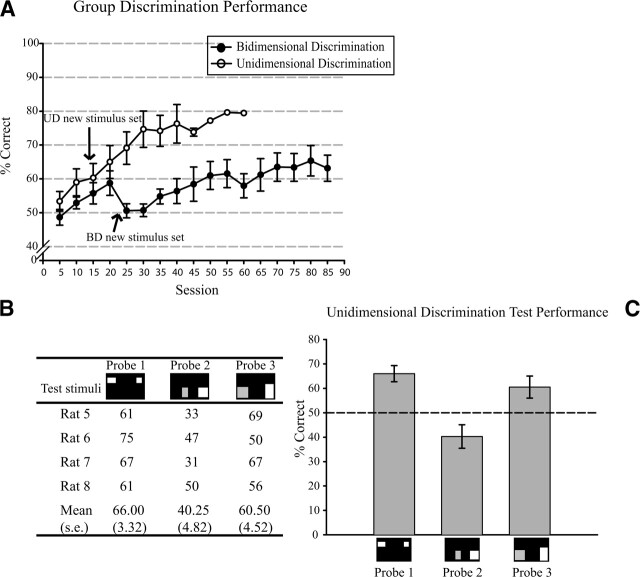
Figure 5.
(A) Learning curves for the Bidimensional (BD) and Unidimensional (UD) groups. The graph illustrates performance up to criterion for the UD group and just before the testing phase for the BD group. Error bars indicate the standard errors. Individual (B) and group (C) performance in the three probes. (Arrows) Introduction of additional stimuli into the training sets. For the UD rats, stimuli of altered luminance were added after session 13 to discourage use of simple brightness as a discriminand. For the BD rats, intermediate-sized rectangles were added after session 18 to foil the use of an “avoid/choose extreme shapes” rule. Note that the rats fell back to chance at this point, suggesting they were indeed using a strategy other than shape to solve the task.

