
Figure 1.
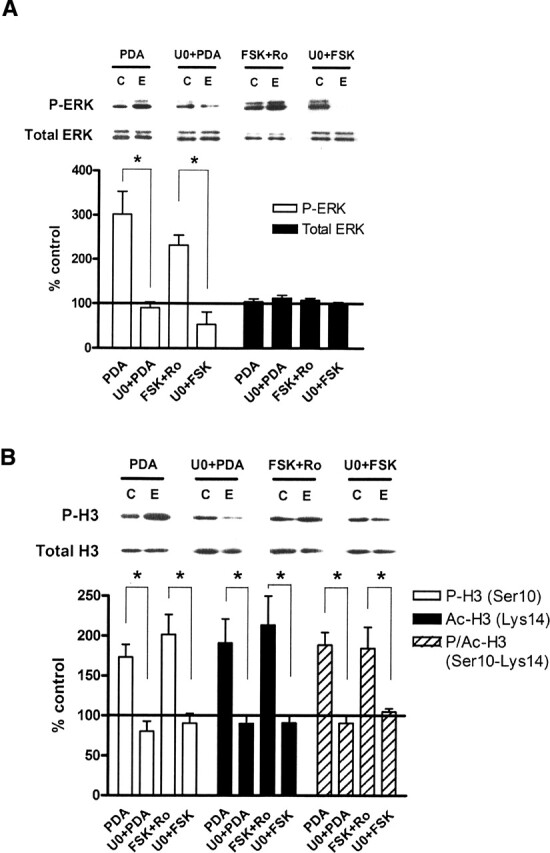
Activation of ERK regulates histone H3 phosphorylation, acetylation, and phospho-acetylation in vitro. (A) Quantification of immunoblot densities for phospho-ERK and total ERK. Treatment of hippocampal slices with PDA (3 μM, n = 9) or FSK (50 μM with 100 μM Ro20-1724, n = 9) for 1 h significantly increased phosphorylation of ERK2 in area CA1. Pre-incubation of slices with U0126 (20 μM, n = 5) for 10 min followed by PDA or FSK blocked the increase in ERK2 phosphorylation. Total ERK protein was unchanged in all treatments. Representative immunoblots for P-ERK and total ERK are shown for each treatment condition. Control (C) samples appear on the left, and experimental (E) samples appear on the right. (B) Quantification of immunoblot densities for phospho-histone H3, acetyl-histone H3, and phospho-acetyl-histone H3. Treatment of hippocampal slices with PDA (3 μM, n = 7) or FSK (50 μM with 100 μM Ro20-1724, n = 6) for 1 h significantly increased phosphorylation, acetylation, and phospho-acetylation of histone H3 in area CA1. Pre-incubation of slices with U0126 (20 μM, n = 5) for 10 min followed by PDA or FSK blocked these changes. Total histone H3 protein was unchanged. Representative immunoblots for P-H3 and total H3 are shown for each treatment condition. Control (C) samples appear on the left, and experimental (E) samples appear on the right. All drug-treated slices were compared with vehicle-treated controls. Error bars indicate standard error of the mean. Asterisks denote significant differences (P < 0.05) as determined by Tukey’s multiple comparison test.