
Figure 2.
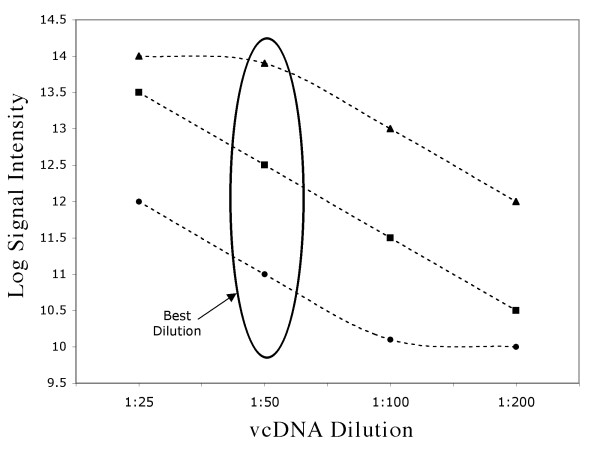
Signal intensity (log2) of high (▲), medium (■) and low (●) mRNA abundances vs dilution. 1:25 dilution saturates high abundance RNA samples whereas 1:200 dilution results in undetectable signal for low abundance RNA. High, medium and low mRNA abundances. 1:50 dilution produces detectable but not saturated signal for the most spots.