
Figure 3.
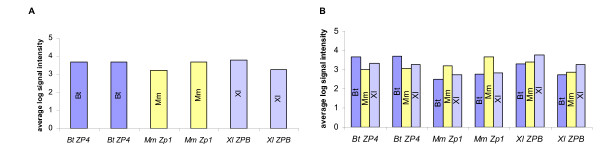
Same-species versus cross-species hybridization. The hybridization pattern of one member of the Zp gene family is represented. Average log signal intensities for two different clones corresponding to the same Zp genes from each species for A) same-species hybridization and B) cross-species hybridization. Probe species are indicated inside each bar. Bt; Bos taurus, Mm; Mus musculus, Xl; Xenopus laevis.