Figure 2.

Time series graphs displaying the percent occurrence of climate conditions that were suitable for malaria transmission during 1951–2000 at the location of interest. Graphs for central Burkina Faso are shown.

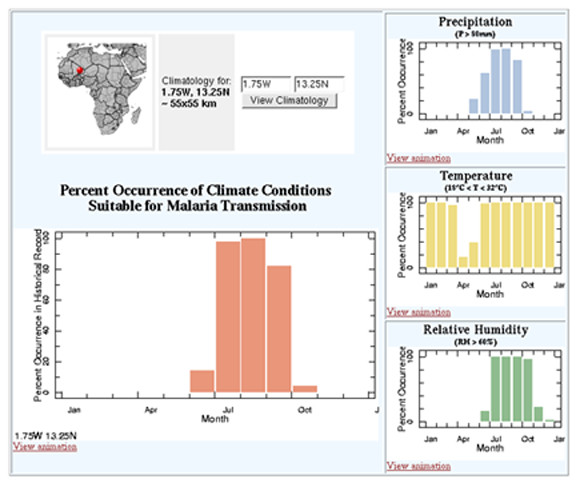
Time series graphs displaying the percent occurrence of climate conditions that were suitable for malaria transmission during 1951–2000 at the location of interest. Graphs for central Burkina Faso are shown.