
Figure 3.
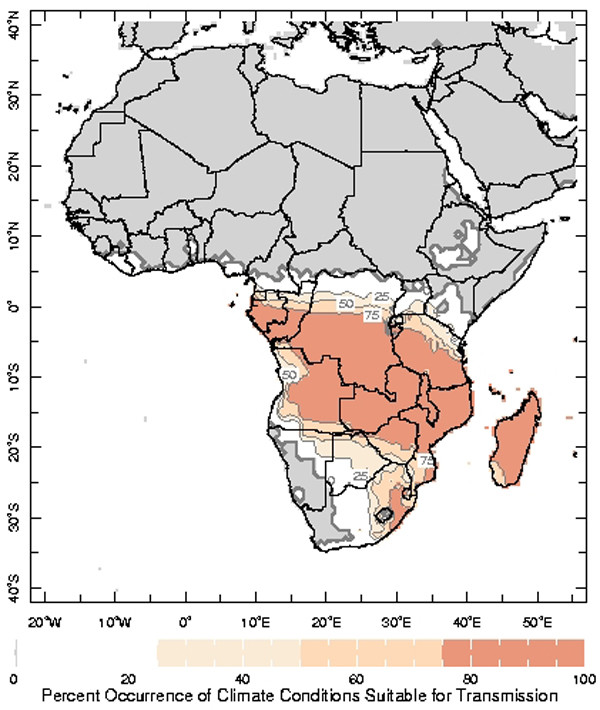
A single frame (January) of the 12-month animation of the percent occurrence of climate conditions which are suitable for malaria transmission during 1951–2000.
Official websites use .gov
A
.gov website belongs to an official
government organization in the United States.
Secure .gov websites use HTTPS
A lock (
) or https:// means you've safely
connected to the .gov website. Share sensitive
information only on official, secure websites.
A single frame (January) of the 12-month animation of the percent occurrence of climate conditions which are suitable for malaria transmission during 1951–2000.