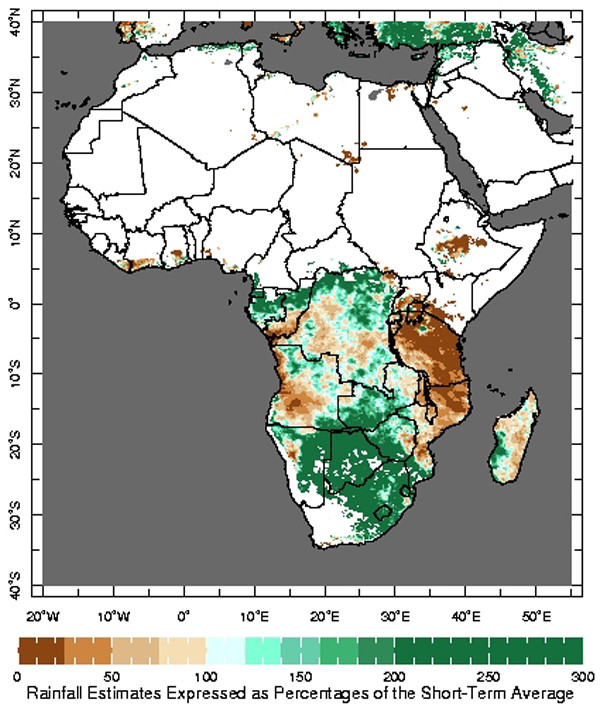
Figure 5.

The Rainfall Estimate Percentages map illustrating the most recent dekadal rainfall estimates expressed as a percentage of the short-term average rainfall during the same time of the year. Only areas receiving at least 7 mm of rainfall per dekad, based on the short-term average, are included in the analysis.
