Abstract
Extracts of Tinospora cordifolia (TCE) have been shown to possess anti-tumor properties, but the mechanism of the anti-tumor function of TCE is poorly understood. This investigation elucidates the possible mechanism underlying the cytotoxic effects of dichlormethane extracts of TCE, after selecting optimal duration and concentration for treatment. HeLa cells were exposed to various concentrations of TCE, which has resulted in a concentration-dependent decline in the clonogenicity, glutathione-S-transferase (GST) activity and a concentration-dependent increase in lipid peroxidation (TBARS) with a peak at 4 h and lactate dehydrogenase (LDH) release with a peak at 2 h. Our results suggest that the cytotoxic effect of TCE may be due to lipid peroxidation and release of LDH and decline in GST.
Keywords: cytotoxicity, glutathione-S-transferase, Guduchi, HeLa, lactate dehydrogenase, lipid peroxidation
Introduction
Tinospora cordifolia Miers, commonly known as ‘Guduchi’ in India, contains tinosporine, tinosporide, tinosporaside, cordifolide, cordifol, heptacosanol, clerodane furano diterpene, diterpenoid furanolactone tinosporidine, columbin and b-sitosterol. The aqueous extract of guduchi stem has shown the presence of arabinogalactan that showed immunological activity (1). The methanolic extract of the plant contains phenylpropanoids, norditerpene furan glycosides, diterpene furon glycosides and plytoecdysones (2). The stem is used in dyspepsia, fevers and urinary diseases. The bitter principle present shows antiperiodic, antispasmodic, anti-inflammatory and antipyretic properties (3–5). Pre-treatment with T. cordifolia has also been shown to afford protection against induced infections in mice and rats and has been found to be non-toxic in humans (6–8).
Guduchi has been reported to treat throat cancer in humans (9). The preliminary studies on the stem extracts of T. cordifolia have shown promising responses in cultured HeLa cells, where various extracts of guduchi at concentrations of 0, 5, 10, 25, 50 and 100 µg ml−1 reduced the cell survival in a dose-dependent manner. Dichloromethane extract is the most promising one as far as cytotoxic effect is concerned (5). These preliminary studies were done to establish the cytotoxic effect of guduchi at higher doses.
A polysaccharide present in T. cordifolia inhibit metastases in the lungs of syngeneic C57BL/6 mice, when the drug was administered simultaneously with tumour challenge (10). Singh et al. (11) have reported that an alcoholic extract of T. cordifolia enhanced the differentiation of TAM to dendritic cells, in response to granulocyte/macrophage-colony-stimulating factor, interleukin-4 and tumor necrosis factor. Our own earlier studies on mice transplanted with Ehrlich ascites carcinoma have shown that 50 mg kg−1 body weight of dichloromethane extract of guduchi inhibited the proliferation of tumor cells (12). In earlier studies higher concentrations of dichloroethane extracts were evaluated after exposing the cells arbitrarily for 2 h, where no attempt was made to study the effect of treatment time. A maximum cytotoxic effect was reported for dichloromethane extract of guduchi in comparison with the aqueous and methanol extracts. Therefore, the authors decided to evaluate the antineoplastic activity of dichloromethane extract of guduchi stems at lower concentrations on cultured HeLa cells after exposing the cells to different treatment times.
Materials and Methods
Collection and Extraction of Plant Material
The stems of Tinospora cordifolia (Willd.) Miers ex Hook. F. & Thoms. (Family: Menispermaceae) were collected from Manipal, India during the month of March, 2002, shade dried and coarsely powdered with the help of a ball mill. The plant material (20 kg) was exhaustively extracted with 5 l each of petroleum ether (60–80°C), chloroform and dichloromethane, respectively, using a Soxhlet continuous extraction apparatus for 1 week. The final dichloromethane extracts (henceforth TCE) were concentrated in vacuo and dried under reduced pressure. An approximate yield of 1.2% w/w was obtained.
TCE and doxorubicin hydrochloride (DOX) were dissolved in dimethyl sulfoxide (DMSO) at a concentration of 5 mg ml−1 and diluted in sterile MEM in such a way so as to obtain required concentrations. All drug solutions were prepared afresh immediately before use.
Cell Line and Culture Methods
HeLa S3 cells procured from National Centre for Cell Science, Pune, India, were used throughout the study. The HeLa S3 cells have a doubling time of 20 ± 2 h. The cells were routinely grown in the 25 cm2 culture flasks (Techno Plastic Products, Trasadingën, Switzerland) with loosened caps containing Eagle's minimum essential medium (MEM) supplemented with 10 percent fetal calf serum, 1 percent l-glutamine and 50 µg ml−1 gentamicin sulfate at 37°C in an atmosphere of 5 percent CO2 in humidified air in a CO2 incubator (NuAir, Plymouth, USA).
The whole cell growth experiments were done on already established monolayers of HeLa cells. A fixed number (5 × 10⁵) of exponentially growing cells were seeded into several culture flasks (Techno Plastic Products, Trasadingën, Switzerland) and were allowed to reach plateau phase.
Selection of Optimum Duration
The optimum duration for drug exposure was evaluated by Pratt and Willis test (13) in HeLa cells. Briefly, 1 × 10⁵ cells were seeded in 25 cm2 culture dishes (Cellstar, Greiner, Germany). They were allowed to grow for 24 h. An aliquot of 8 µg ml−1 of TCE was added and after 0, 1, 2, 4, 6, 8, 12, 18 or 24 h, the TCE-containing medium was replaced with a fresh drug-free medium. After 72 h of initiating of cultures, the cells were harvested and counted using a hemocytometer (American Optics, USA) under an inverted microscope (Labovert microscope, Ernst, Leitz GmbH, Wetzlar, Germany). The viability of cells was determined using Trypan blue dye-exclusion test.
The results obtained from Pratt and Willis assay (13) were confirmed by clonogenic assay (14), where 200 cells were plated on to several individual culture dishes (Cellstar, Greiner, Germany) containing 5 ml drug-free medium in triplicate for each drug dose for each group. The cells were exposed to 8 µg ml−1 TCE for 0, 1, 2, 4, 6, 8, 12, 18 or 24 h, respectively. The cells were allowed to grow for 11 days. The resultant colonies were stained with 1 percent crystal violet in methanol and clusters containing 50 or more cells were scored as a colony. The plating efficiency of cells was determined and the surviving fraction was fitted on to a linear quadratic model?, SF = exp − (αD + βD2).
Effect of Various Concentrations of TCE
The plateau phase cell cultures were divided into the following groups according to the treatment:
DMSO group. The cells of this group were treated with 2 µl ml−1 of DMSO (negative control).
TCE group. The cell cultures of this group were exposed to 0, 1, 2, 4, 5, 6 or 8 µg ml−1 of TCE.
The TCE-containing medium was removed from each culture flask of each group after 4 h and the cells were washed twice with sterile PBS. The cells from each group of flasks were dislodged by trypsin EDTA treatment and divided into two parts and the following assays were carried out.
Cytotoxicity of various treatments was measured by Pratt and Wills test (13) as described earlier, except that HeLa cells were treated with 0, 1, 2, 4, 5, 6 or 8 µg ml−1 TCE for 4 h. Results obtained from Pratt and Willis assay were confirmed by clonogenic assay (14) as described above, except that HeLa cells were treated with 0, 1, 2, 4, 5, 6 or 8 µg ml−1 TCE for 4 h.
Assay of Enzyme Activity
A separate experiment was carried out to examine the effect of 0, 1, 2, 4, 6 or 8 µg ml−1 TCE on enzyme activities in cell homogenates [lipid peroxidation and glutathione-S-transferase (GST)] or medium (lactate dehydrogenase, LDH) at different post-TCE treatment times. The grouping and other conditions were essentially similar to those as described above, except that 10 µg ml−1 DOX was used as a positive control. The enzyme contents released in the medium (LDH) or cell homogenates of all groups were determined at 0, 0.5, 1, 2, 4, 8 or 12 h post-treatment. The absorbance was recorded for all assays using a UV-visible double beam spectrophotometer (UV-260, Shimadzu Corp., Tokyo, Japan).
Lipid peroxidation (TBARS) was measured by the method of Buege and Aust (15). Briefly, the cell homogenate was mixed with TCA–TBA–HCl and heated for 15 min in a boiling water bath. After centrifugation the absorbance was recorded at 535 nm. Lipid peroxidation in the samples was determined against the standard curve of MDA (Malondialdehyde) and expressed as TBARS, U mg−1 protein. The activity of LDH was estimated at 0, 0.5, 1, 2, 4, 8 or 12 h post-drug treatment in the culture medium of all three groups simultaneously. The estimation of LDH release in the culture medium was carried out by the method described by Decker and Lohman-Matthes (16) with minor modifications. The whole medium from each cell culture of each group was removed and collected separately immediately after TCE treatment and was considered 0 h after treatment. The cells were fed with a fresh 5 ml medium and the above procedure (removal of media) subsequently repeated at 0.5, 1, 2, 4, 8 and 12 h. Briefly, the tubes containing media were centrifuged and 50 µl of the medium was transferred to the individual tubes containing Tris–EDTA–NADH buffer followed by 10 min incubation at 37°C and the addition of pyruvate solution. The absorbance was read at 339 nm and the data expressed as units per litre (U l−1). The cytosolic GST activity was determined spectrophotometrically at 37°C according to the procedure of Habig et al. (17). Briefly, the reaction mixture (2.7 ml of 100 mM phosphate buffer (pH 6.5) and 0.1 ml of 30 mM CDNB) was preincubated at 37°C for consecutive 5 min, and the reaction initiated by adding 0.1 ml of supernatant and the absorbance recorded for 5 min at 340 nm. Reaction mixture without the enzyme was used as a blank. The GST activity is expressed as U mg−1 protein.
Statistical Analysis
The statistical analyses were performed using GraphPad Prism 2.01 statistical software (GraphPad Software, San Diego, CA, USA). The significance among all groups was determined by one-way ANOVA and Bonferroni's post hoc test applied for multiple comparisons. All the investigations were carried out from the same stock of cells concurrently. The whole cell growth experiments were done on already established monolayers of HeLa cells. The experiments were repeated for confirmation of results that are the average of five individual experiments. The test of homogeneity was applied to determine variation among each experiment. The data of each experiment did not differ significantly from one another and hence, all the values have been combined and means calculated. A P-value < 0.05 was considered statistically significant.
Results
The results are expressed as percent viability for Pratt and Willis assay and surviving fraction (SF) for clonogenic assay in Figs 1 and 2. The results of biochemical analysis are expressed as lipid peroxidation (TBARS, U mg−1 protein); LDH (U l−1) and GST as U mg−1 protein, in Figs 1, 2 and 3.
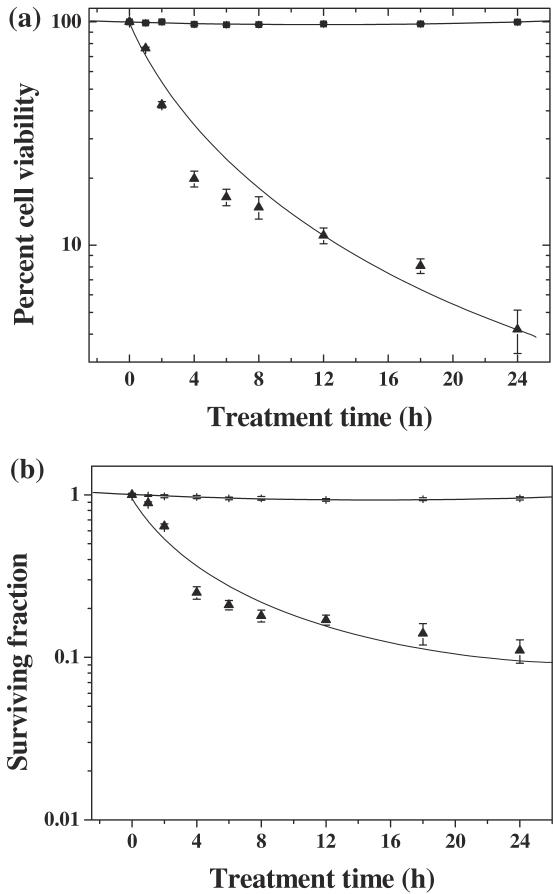
Figure 1.
Effect of treatment period of dichloromethane extract of guduchi on survival in HeLa cells. Closed squares, DMSO; closed triangles, TCE. (a) Cell viability and (b) cytotoxicity.
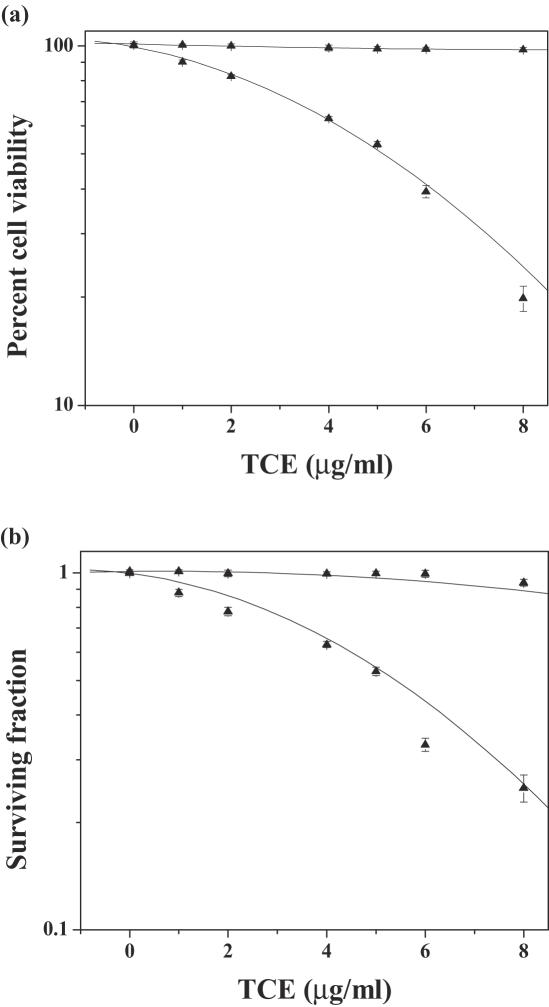
Figure 2.
Effect of various concentrations of dichloromethane extract of guduchi (TCE) on survival in cultured HeLa cells. Closed squares, DMSO; closed triangles, TCE. (a) Cell viability and (b) cytotoxicity.
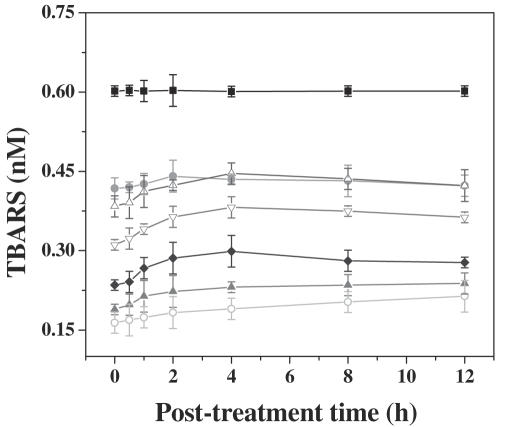
Figure 3.
Effect of various concentrations of dichloromethane extract of guduchi (TCE) on extent of lipid peroxidation (LPx) in cultured HeLa cells. Closed squares, DMSO; closed circles, DOX; open triangles, 1 µg ml−1 TCE; open inverted triangles, 2 µg ml−1 TCE; closed diamonds, 4 µg ml−1 TCE; closed triangles, 6 µg ml−1 TCE; open circles, 8 µg ml−1 TCE.
Selection of Optimum Duration
DMSO (negative control) treatment did not alter the spontaneous viability of HeLa cells significantly with time (Fig. 1a). Treatment of HeLa cells with TCE caused a time-dependent decline in the cell viability and a lowest viability was observed after 24 h of TCE treatment. Cell viability declined to ∼80% after 4 h TCE treatment when compared with 2 h post-treatment. Thereafter, a gradual decline was observed (Fig. 1a). The reproductive integrity of HeLa cells remained unaffected by DMSO (negative control) treatment with time, as evidenced by non-significant changes in the surviving fraction (SF) of HeLa cells (Fig. 1b). Exposure of TCE for various time periods exhibited a time-dependent decrease in the SF. The SF reduced to 0.25 after 4 h of TCE treatment, thereafter, clonogenecity of HeLa cells declined steadily with exposure time up to 24 h post-treatment (Fig. 1b). However, the decline in SF was statistically non-significant and therefore, 4 h exposure time was considered as an optimum time and further studies were carried out using this time of TCE exposure.
Various Concentrations of TCE Cause a Decline in Viability
The spontaneous viability of HeLa cells remained unaltered after treatment of DMSO, the negative control (Fig. 1a). The viability of HeLa cells declined in a dose-dependent manner after exposure to various doses of TCE and the lowest viability of 20 percent was observed for the highest concentration of 8 µg ml−1 (Fig. 1a). However, the effect of TCE treatment was always greater than that of DMSO treatment. The reproductive integrity of HeLa cells remained unaffected by DMSO (negative control) treatment as evidenced by non-significant alterations in the survival of HeLa cells (Fig. 1b). Exposure of HeLa cells to various concentrations of TCE, resulted in a concentration-dependent decline in the clonogenecity of HeLa cells as evidenced by a continuous decline in the cell survival and a lowest SF of 0.25 was obtained for 8 µg ml−1 (Fig. 1b). The IC50 was found to be approximately 5.2 µg ml−1.
TCE (Dichloromethane Extracts) Affect Enzyme Activity
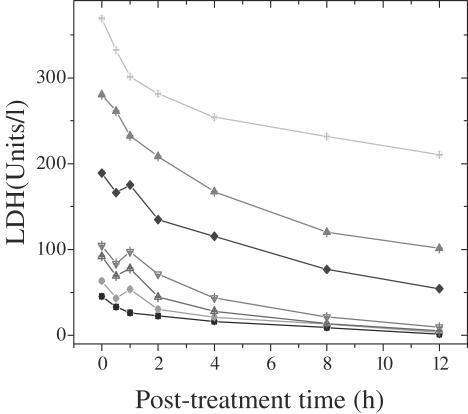
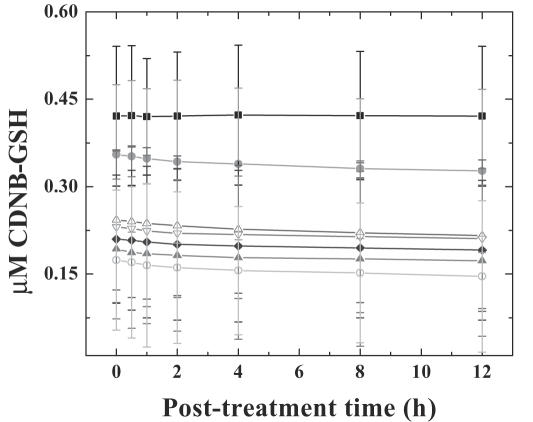
DMSO treatment (negative control) did not alter the spontaneous levels of TBARS, LDH and GST significantly, with assay time. Treatment of HeLa cells with 0, 1, 2, 4, 6 or 8 µg ml−1 TCE, showed a time-dependent elevation in the lipid peroxidation for all post-treatment times. The TBARS reached a peak at 4 h post-treatment and plateaued thereafter. The concentration of TBARS was 1.2-fold greater than that of DOX treatment (positive control), whereas it was 2.8-fold higher when compared with DMSO treatment, negative control (Fig. 3). Exposure of HeLa cells to various concentrations of TCE elevated the LDH contents gradually with time and a maximum release was observed at 1 h post-treatment (since the whole media was removed at each time, the values in tables and graphs are lower with subsequent assay periods). The LDH contents were 1.2-fold higher after TCE treatment when compared with the positive control, DOX group (Fig. 4). Cytosolic GST decreased with time in the HeLa cells treated with TCE and the greatest decline was observed at 12 h post-treatment when compared with positive control, DOX (Fig. 5). Exposure of HeLa cells to TCE resulted in a significant decline in GST at all post-treatment times and the greatest decline was observed for 8 µg ml−1 (Fig. 5). This decline in GST activity with time was non-significant.
Figure 4.
Effect of various concentrations of dichloromethane extract of guduchi (TCE) on LDH release in cultured HeLa cells. Closed squares, DMSO; closed circles, DOX; open triangles, 1 µg ml−1 TCE; open inverted triangles, 2 µg ml−1 TCE; closed diamonds, 4 µg ml−1 TCE; closed triangles, 6 µg ml−1 TCE; open circles, 8 µg ml−1 TCE.
Figure 5.
Effect of various concentrations of dichloromethane extract of guduchi (TCE) on GST activity in cultured HeLa cells. Closed squares, DMSO; closed circles, DOX; open triangles, 1 µg ml−1 TCE; open inverted triangles, 2 µg ml−1 TCE; closed diamonds, 4 µg ml−1 TCE; closed triangles, 6 µg ml−1 TCE; open circles, 8 µg ml−1 TCE.
Discussion
The cytotoxic effect of TCE increased in a dose-dependent manner in HeLa cells, and an 80 percent decline in SF was observed for 4 h treatment duration. Therefore, further studies were carried out using this time of TCE exposure. The reports on the use of various treatment time of TCE are unavailable. Earlier, different extracts of guduchi were found to be cytotoxic and cytoxicity increased in a concentration-dependent manner. The greatest cytotoxic effect was observed for dichloromethane extract followed by the methanol extract of Tinospora, whereas aqueous extract was least toxic among all the extracts of Tinospora evaluated. Further, in earlier studies the concentrations used were higher than that used in the present study and no attempts were made to examine the effect of treatment duration on the cytotoxicity after treatment (5). Reports on the cytotoxic effects of Tinospora, except our own are unavailable, however, alcoholic extract of Tinospora has been reported to be cytotoxic in a transplantable mouse tumor (11).
The exact mechanism of cytotoxic effect of guduchi is not known. Increased lipid peroxidation, LDH release accompanied by a decline in GST concentration by guduchi are some of the important events leading to cell death. Lipid peroxidation is an important event related to cell death and has been reported to cause severe impairment of membrane function through increased membrane permeability and membrane protein oxidation and eventually cell death by damaging the cellular DNA (18,19). This is corroborated by increased TBARS after TCE treatment, which was 1.2-fold higher, when compared with the positive control, DOX. Similarly, LDH, an another indicator of cell damage was found to increase in a time-dependent manner up to 12 h. The measurement of LDH release is useful in assessing the cytotoxicity of cells (16). The LDH activity is closely related to the decline in surviving fraction.
The cytotoxic action of guduchi could be attributed to the presence of alkaloids, diterpenoid lactones, glycosides, steroids, sesquiterpenoid, phenolics, aliphatic compounds or polysaccharides. Alkaloids like berberine, palmatine, tembetarine, choline, tinosporin, isocolumbin, palmatine, tetrahydropalmatine and magnoflorine have been isolated from the non-polar fraction of extracts of stem and roots of T. cordifolia (3,4,20–25). Tinospora cordifolia has also been found to contain an immunomodulator arabinogalactan in polar fraction (1). Although scientific studies have been done on a large number of Indian botanicals, a considerably smaller number of marketable drugs or phytochemical entities have entered the evidence-based therapeutics (26). The authors would like to ascertain that guduchi is a promising drug entity which should enter the world market by evidence-based research for therapeutics.
The present study demonstrates that TCE exerted cytotoxic effect in a concentration-dependent manner and the cytotoxic effect could be due to DNA damage, inhibition of topoisomerase II, increased TBARS and LDH accompanied by a decrease in GST.
Acknowledgments
The authors are thankful to Prof. U Rajagopal, Department of Botany, Mahatma Gandhi Memorial College, Udupi, India for the taxonomic identification of guduchi (T. cordifoia). The financial assistance in the form of Senior Research Fellowship to S.K.R., provided by the Council for Scientific and Industrial Research (CSIR), New Delhi, India, to carry out the above study is gratefully acknowledged.
References
- 1.Chintalwar G, Jain A, Sipahimalani A, Banerji A, Sumariwalla P, Ramakrishnan R, et al. An immunologically active arabinogalactan from Tinospora cordifolia. Phytochemistry. 1999;52:1089–93. doi: 10.1016/s0031-9422(99)00386-6. [DOI] [PubMed] [Google Scholar]
- 2.Gangan VD, Pradhan P, Sipahimalani AT. Phytoecdysones from Tinospora cordifolia: structural elucidation of ecdysterone and makisterone A by 2D NMR spectroscopy. Ind J Chem. 1997;36B:787–92. [Google Scholar]
- 3.Thatte UM, Kulkarni MR, Dahanukar SA. Immunotherapeutic modification of Escherichia coli peritonitis and bacteremia by Tinospora cordifolia. J Postgrad Med. 1992;38:13. [PubMed] [Google Scholar]
- 4.Dahanukar SA, Thatte UM, Pai NR, More PB, Karandikar SM. Immunotherapeutic modification by Tinospora cordifolia of abdominal sepsis induced by caecal ligation in rats. Ind J Gastroenterol. 1988;7:21–3. [PubMed] [Google Scholar]
- 5.Jagetia GC, Nayak V, Vidyasagar MS. Evaluation of the antineoplastic activity of guduchi (Tinospora cordifolia) in cultured HeLa cells. Can Lett. 1998;127:71–82. doi: 10.1016/s0304-3835(98)00047-0. [DOI] [PubMed] [Google Scholar]
- 6.Samy RP. Antimicrobial activity of some medicinal plants from India. Fitoterapia. 2005;76:697–9. doi: 10.1016/j.fitote.2005.06.011. [DOI] [PubMed] [Google Scholar]
- 7.Badar VA, Thawani VR, Wakode PT, Shrivastava MP, Gharpure KJ, Hingorani LL, Khiyani RM. Efficacy of Tinospora cordifolia in allergic rhinitis. J Ethnopharmacol. 2005;96:445–9. doi: 10.1016/j.jep.2004.09.034. [DOI] [PubMed] [Google Scholar]
- 8.CHEMEXCIL. Selected Medicinal Plants of India (A Monograph of Identity, Safety) Bombay, India: Basic Pharmaceutical and Cosmetic Export Promotion Council; 1992. pp. 319–22. [Google Scholar]
- 9.Chauhan K. Successful treatment of throat cancer with Ayurvedic drugs. Suchitra Ayurved. 1995;47:840–2. [Google Scholar]
- 10.Leyon PV, Kuttan G. Inhibitory effect of a polysaccharide from Tinospora cordifolia on experimental metastasis. J Ethnopharmacol. 2004;90:233–7. doi: 10.1016/j.jep.2003.09.046. [DOI] [PubMed] [Google Scholar]
- 11.Singh N, Singh SM, Shrivastava P. Effect of Tinospora cordifolia on the antitumor activity of tumor-associated macrophages-derived dendritic cells. Immunopharmacol Immunotoxicol. 2005;27:1–14. doi: 10.1081/iph-51287. [DOI] [PubMed] [Google Scholar]
- 12.Jagetia GC, Rao SK. Evaluation of the antineoplastic activity of guduchi (Tinospora cordifolia) in Ehrilch ascites carcinoma bearing mice. Biological and Pharmaceutical Bulletin. 2006;29:460–6. doi: 10.1248/bpb.29.460. [DOI] [PubMed] [Google Scholar]
- 13.Pratt RM, Willis WD. In vitro screening assay for teratogens using growth inhibition of human embryonic cells. Proc Natl Acad Sci USA. 1985;82:5791–4. doi: 10.1073/pnas.82.17.5791. [DOI] [PMC free article] [PubMed] [Google Scholar]
- 14.Puck TT, Marcus I. Action of X-rays on mammalian cells. J Exp Med. 1956;103:653–66. doi: 10.1084/jem.103.5.653. [DOI] [PMC free article] [PubMed] [Google Scholar]
- 15.Buege JA, Aust SD. Microsomal lipid peroxidation. Meth Enzymol. 1978;52:302–10. doi: 10.1016/s0076-6879(78)52032-6. [DOI] [PubMed] [Google Scholar]
- 16.Decker T, Lohmann-Matthes ML. A quick and simple method for the quantitation of lactate dehydrogenase release in measurements of cellular cytotoxicity and tumor necrosis factor (TNF) activity. J Immunol Meth. 1988;115:61–9. doi: 10.1016/0022-1759(88)90310-9. [DOI] [PubMed] [Google Scholar]
- 17.Habig WH, Pabst MJ, Jakoby WB. Glutathione-S-transferases. The first enzymatic step in mercapturic acid formation. J Biol Chem. 1974;249:7130–9. [PubMed] [Google Scholar]
- 18.Bartsch H, Nair J. Potential role of lipid peroxidation derived DNA damage in human colon carcinogenesis: studies on exocyclic base adducts as stable oxidative stress markers. Cancer Detection Prev. 2002;26:308–12. doi: 10.1016/s0361-090x(02)00093-4. [DOI] [PubMed] [Google Scholar]
- 19.Marnett LJ. Oxy radicals, lipid peroxidation and DNA damage. Toxicology. 2002;27:219–22. doi: 10.1016/s0300-483x(02)00448-1. [DOI] [PubMed] [Google Scholar]
- 20.Qudrat-I-Khuda M, Khaleque A, Ray N. Tinospora cordifolia. L. Constituents of the plant fresh from the field. Scientific Res (Dacca) 1964;1:177–83. [Google Scholar]
- 21.Bisset NG, Nwaiwu J. Quaternary alkaloids of Tinospora species. Planta Medica. 1983;48:225–9. doi: 10.1055/s-2007-969933. [DOI] [PubMed] [Google Scholar]
- 22.Kumar S, Verma NS, Pande D, Srivastava PS. In vitro regeneration and screening of berberine in T. cordifolia. J Med Arom Plant Sci. 2000;22:61. [Google Scholar]
- 23.Chi CW, Chang YF, Chao TW, Chiang SH, eng FKP, Liu WY, et al. Flowcytometric analysis of the berberine on the expression of glucocorticoid receptors in human hepatoma HepG2 cells. Life Sci. 1994;54:2099–2107. doi: 10.1016/0024-3205(94)00719-5. [DOI] [PubMed] [Google Scholar]
- 24.Padhya MA. Biosynthesis of isoquinoline alkaloid berberine in tissue cultures of Tinospora cordifolia. Ind Drugs. 1986;24:47–8. [Google Scholar]
- 25.Sarma DNK, Padma P, Khosa RL. Constituents of Tinospora cordifolia root. Fitoterapia. 1998;69:541–2. [Google Scholar]
- 26.Patwardhan B, Warude D, Pushpagandhan P, Bhatt N. Ayurveda and traditional Chinese medicine: a comparative overview. Evid Based Complement Alternat Med. 2005;2:465–73. doi: 10.1093/ecam/neh140. [DOI] [PMC free article] [PubMed] [Google Scholar]


