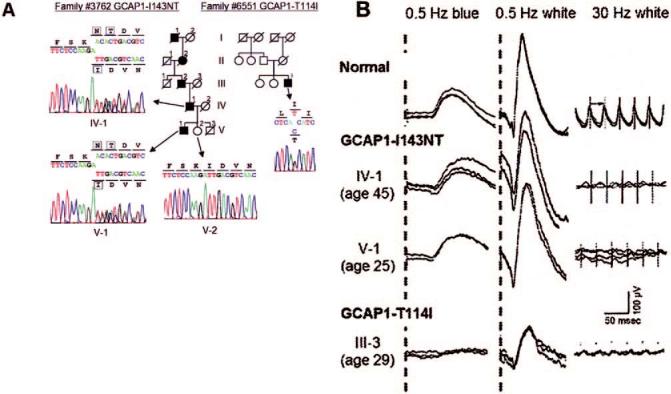
FIGURE 1.

Analyses of family #3762 with GCAP1-I143NT and family 6551 with GCAP1-T114I. (A) Sequences of two novel missense changes in GCAP1 and schematic pedigrees of the corresponding families. Filled symbols: affected individuals; open symbols: unaffected individuals. Arrows point to the sequence results of relevant family members. Boxes denote residues at the mutation site. (B) Dark-adapted, full-field ERGs from a normal control individual (top), two patients with GCAP1-I143NT (middle), and a patient with GCAP1-T114I (bottom). The patients with GCAP1-I143NT are individuals IV-1 and V-1 of family #3762; the patient with GCAP1-T114I is individual III-3 of family #6551. Going from left to right, the columns show rod responses to 0.5-Hz blue flashes (1.2 log ft/L, λmax = 440 nm), rod-plus-cone responses to 0.5-Hz white flashes (3.8 log ft/L), and cone responses to 30-Hz white flashes (3.8 log ft/L). For all three columns, the scale bar (right column above the bottom traces) indicates 100 μV vertically and 50 ms horizontally. For each test condition, two to four consecutive sweeps are shown to illustrate reproducibility.
