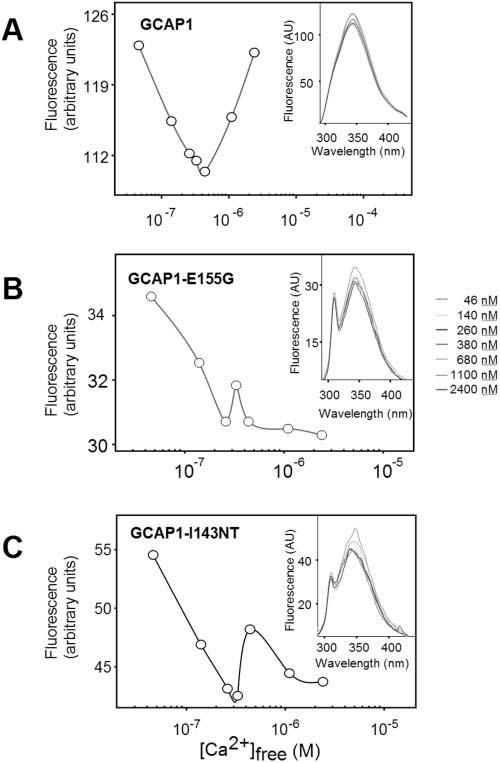
FIGURE 3.

Ca2+-induced conformational changes in GCAP1 and its mutants observed by fluorescence spectroscopy. Changes in fluorescence at λex = 290 nm and λem = 343 nm as a function of [Ca2+]. Insets, fluorescence emission spectra of GCAPs using excitation at 280 nm from 4.6 × 10⁻⁸ M to 2.4 × 10⁻⁶ M Ca2+. (A) Recombinant human GCAP1; (B) GCAP1-E155G; (C) GCAP1-I143NT.
