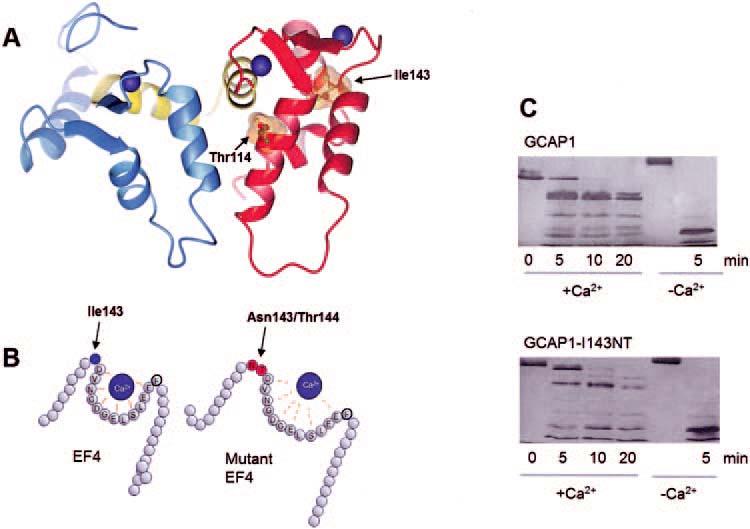
FIGURE 4.

Model of GCAP1 and distortion of EF4 by insertion of two residues. (A) The model of GCAP1 is based on the NMR structure of GCAP2 (as deposited in the Protein Data Bank, PDB ID# 1JBA).50 The N-terminal domain is in blue, the C-terminal domain is in red, and the central helix is in yellow. Ca2+ ions are shown in blue, and the side chains of the residues Ile143 and Thr114 are shown with the van der Waals spheres. (B) A cartoon of EF4 depicting how the replacement of hydrophobic Ile143 by two polar residues may lower affinity for Ca2+.(C) Limited proteolysis of GCAP1 and GCAP1-I143NT by trypsin. The digestion was carried out at 30°C at a ratio of GCAP1/trypsin 300:1, and the digest was analyzed by SDS-PAGE at 0, 5, 10, and 15 minutes; +Ca2+ represents 2 μM [Ca2+] and -Ca2+ indicates 30 nM [Ca2+]. Note that already after 5 minutes of digestion, the high molecular weight components are more extensively digested in GCAP1-I143NT.
