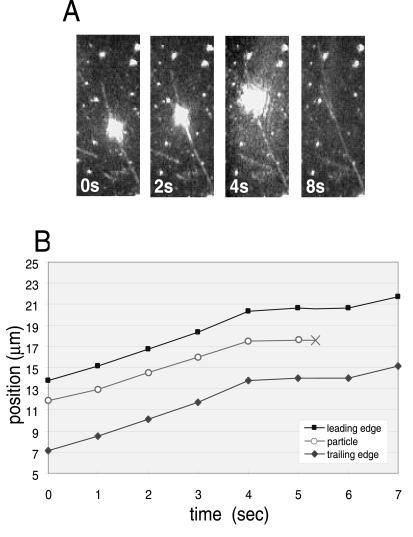
Figure 7.
Analysis of particle detachment in a high salt experiment. (A) Video sequence showing the effect of application of high salt (250 mM tetraethylammonium acetate). (B) Tracing shows abrupt disappearance of the particle from A. Perfusion is begun at 0 s. At 4 s, the particle image expands, presumably as the high salt perfusion reaches this field while MT movement is still seen. X indicates the point when the particle is detached from the MT.

