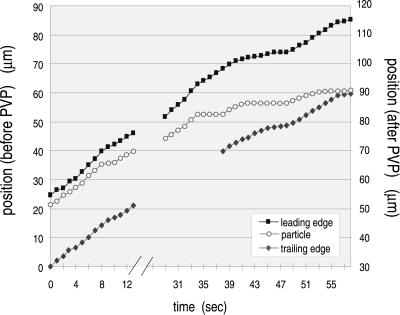
Figure 8.
Effect of increased viscosity on particle movement. Tracing curves for MT ends and attached particle before versus after perfusion of 2% PVP into the translocation chamber. Break in record shows time of PVP addition. PVP addition slowed MT movement somewhat and increased velocity of rearward drift of the particle. Left y-axis corresponds to before PVP and right y-axis corresponds to after PVP.

