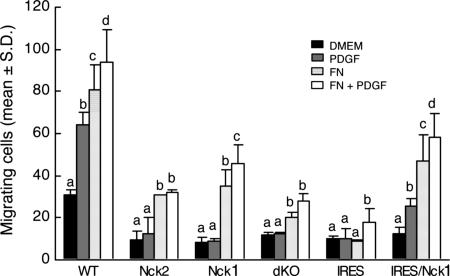
Fig. 2.
Nck deficiency impairs PDGF-B- and fibronectin-stimulated cell migration. Data show the number of migrating cells per microscopic field. Bars represent means ± SD from eight pictures taken at random from each treatment combination in each of two independent experiments. Genotypes compared are WT, Nck1−/− Nck2−/+ (Nck2), Nck1−/+ Nck2−/− (Nck1), Nck−/− Nck2−/− (dKO), and Nck-deficient cells rescued with an empty retroviral vector (IRES) or a retroviral vector expressing Nck (IRES/Nck1). Within each genotype, means with a different letter over the bar are different (P < 0.01).

