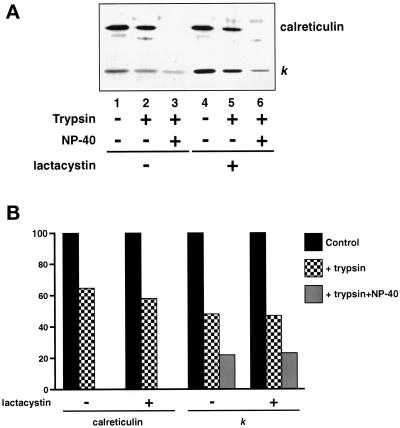
Figure 4.
Trypsin resistance of κNS1 chains. (A) Equal amounts of the P3 fractions prepared from untreated and lactacystin-treated cells were treated with 15 μg/ml trypsin for 30 min at 30°C in the absence or presence of 0.5% NP-40. Digestions were stopped by the addition of 500 μg/ml trypsin inhibitor. Samples were used for either immunoprecipitation of Ig L chains or proving the amount of calreticulin by Western blot. (B) Ig L chain signals were quantified by phosphorimager, calreticulin signals were quantified by scanning densitometry, and the values were plotted as the percentage of the amount of the respective protein present in the corresponding untreated samples. Note that no calreticulin signals could be detected after trypsin digestion of NP-40-solubilized material.

