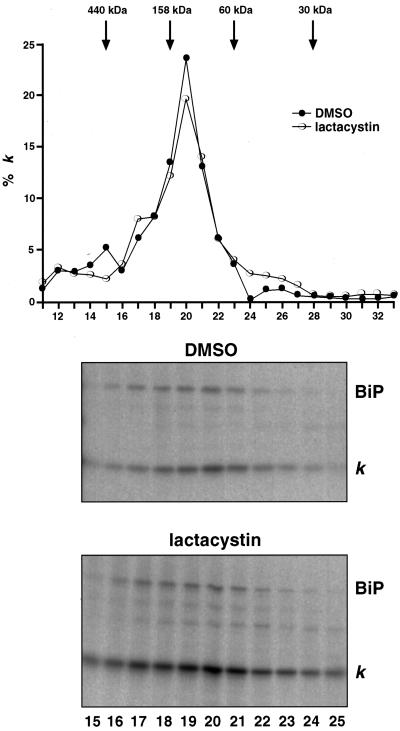
Figure 5.
Size fractionation of κNS1 chains. NS1 cells were starved, labeled, and chased for 3 h in the presence or absence of lactacystin. For solubilization, cell concentrations were adjusted to 107cells/ml of NET buffer. Fifty microliters of sample were applied onto a Superdex 200 column (SMART system), and proteins were separated at a flow rate of 40 μl/min. Fractions of 50 μl were collected and used to immunoprecipitate the Ig L chains that were analyzed by SDS-PAGE under reducing conditions. (A) The signals were quantified by phosphorimager, and the amount of Ig L chains present in each fraction was plotted as the percentage of total Ig L chains present in the load. The molecular mass standarts used were ferritin (440 kDa), aldolase (158 kDa), BSA (60 kDa), and carbonic anhydrase (30 kDa). (B) The autoradiograms of the gels used to quantify the Ig L chain signals (fraction 15–25) are shown. Note that the signals for coprecipitated BiP parallels the Ig L chain distribution.

