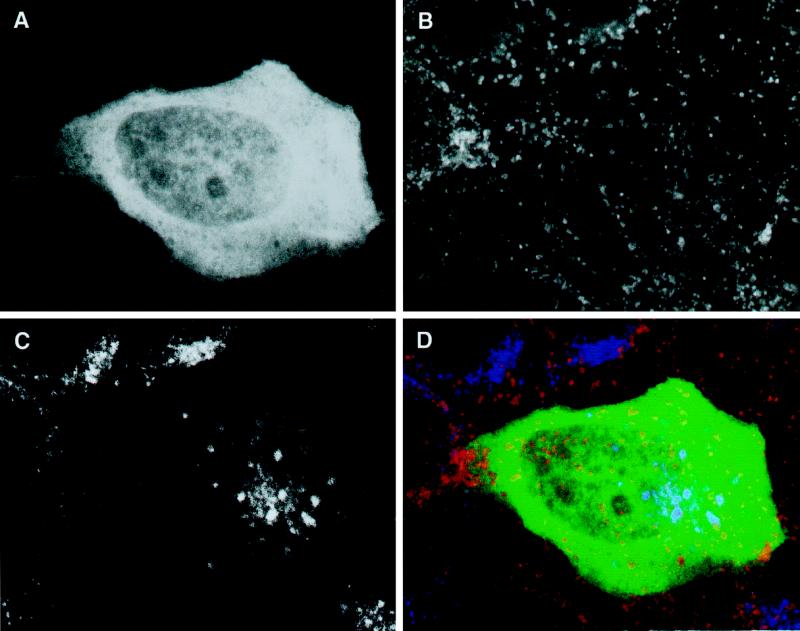
Figure 4.
Distribution of lgp120 and M6PR in cells transfected with GFP-hVPS4(wt). NRK cells transfected with GFP-hVPS4(wt) were visualized directly (A; green) or using anti-lgp120 (B; red) or anti-M6PR (C; blue). The merged image (D) shows the limited codistribution of lgp120 and M6PR. Note the similar distributions of these markers in transfected and neighboring untransfected cells.

