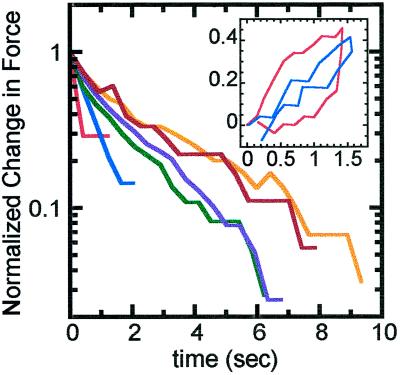
Figure 1.
Log–linear plot of force relaxation in a chromosome in a step–strain experiment. The time courses start immediately after successive chromosome elongations to 2 times (red), 4 times (blue), 8 times (green), 16 times (purple), 60 times (brown), and 100 times (orange) native length. The elongations were done at a fast strain rate of 50 s−1. Time courses of force are shown relative to the final force reached after relaxation and normalized to the initial force measured just after the rapid elongation. Thus we plot (measured force − final force)/initial force, making all the time courses run from 1 to 0 and allowing easier comparison of time scales. All of the relaxation data shown were done on the same chromosome, initially of native length 5 μm. For extensions to less than five times, force relaxation occurs over roughly 2 s; for longer extensions the force relaxation took up to 10 s. Inset, force versus extension curves of a second chromosome extended at two different strain rates. The first extension–relaxation was done at 0.08 s−1 (red); the second extension–retraction was done at 0.02 s−1 (blue). The y-axis is in units of nanonewtons, and the x-axis is in units of normalized extension. The native length was 4.8 μm. The faster experiment shows a force “loop” because the chromosome is not being given time to relax as the extension–retraction is being done. During the slower experiment the chromosome stays in mechanical equilibrium, and coincident force–distance curves are obtained during extension and retraction.

