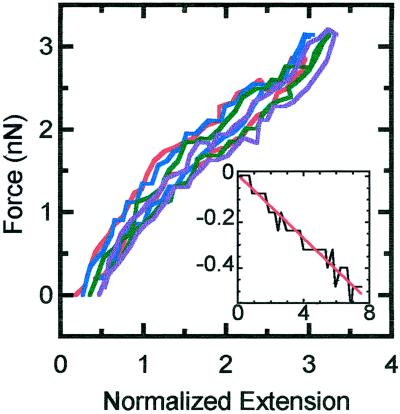
Figure 2.
Force versus extension of a chromosome for small extensions and retractions. The native length of the chromosome is 7.5 μm. The strain rates are 0.007 s−1 (red), 0.01 s−1 (blue), 0.02 s−1 (green), and 0.03 s−1 (purple). The inset plot is the normalized change in width versus normalized change in length of the same chromosome. The black line is the data, and the red line is the linear fit (y = −0.005 + 0.067x).

