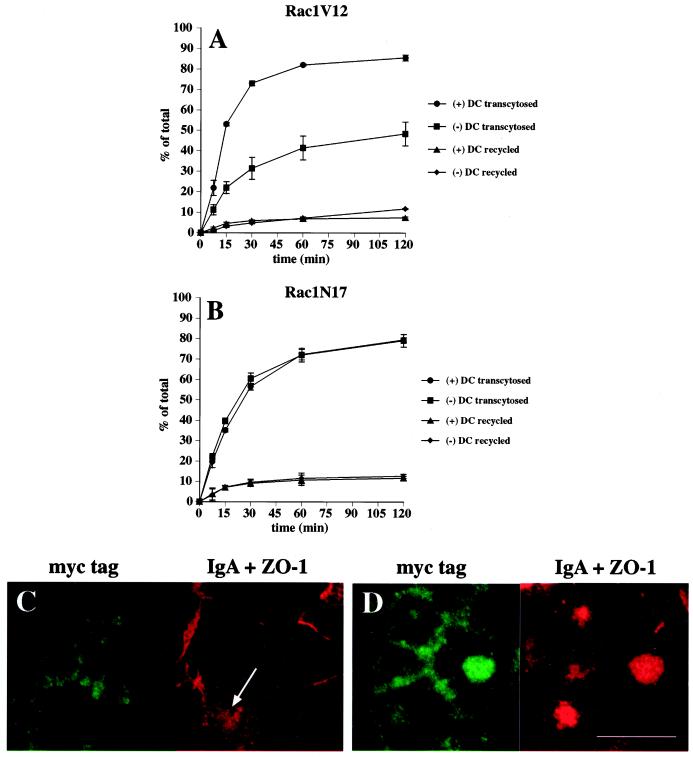
Figure 6.
Postendocytic fate of basolaterally internalized IgA in Rac1V12- and Rac1N17-expressing cells. [125I]IgA was internalized from the basolateral surface of the cells for 10 min at 37°C, and the cells were washed and then chased for 120 min. The percentage of total ligand released apically (transcytosed) or basolaterally (recycled) in cells expressing Rac1V12 (A) or Rac1N17 (B) is shown. Values for degradation were as follows: Rac1V12 + DC, 5.0 ± 0.7%; Rac1V12 − DC, 10.6 ± 0.7%; Rac1N17 + DC, 5.6 ± 0.3%; Rac1N17 − DC, 4.4 ± 0.5%. Values for ligand remaining cell associated were as follows: Rac1V12 + DC, 2.0 ± 0.7%; Rac1V12 − DC, 29.1 ± 6.7%; Rac1N17 + DC, 3.1 ± 0.2%; Rac1N17 − DC, 3.8 ± 1.0%. Values (mean ± SD; n = 3) are from a representative experiment. (C and D) IgA was internalized from the basolateral cell surface for 10 min at 37°C, and the cells were washed and then chased for 60 min at 37°C in ligand-free medium. The cells were fixed, incubated with antibodies against myc-tagged Rac1V12, IgA, and ZO-1, and then reacted with the appropriate secondary antibody coupled to FITC or Cy5. Single optical sections at the level of the tight junctions (C) or the central aggregate (D) were obtained with a scanning laser confocal microscope. The arrow in C demarks a cell in which some IgA is seen accumulating at the apical pole of the cell. Bar, 10 μm.

