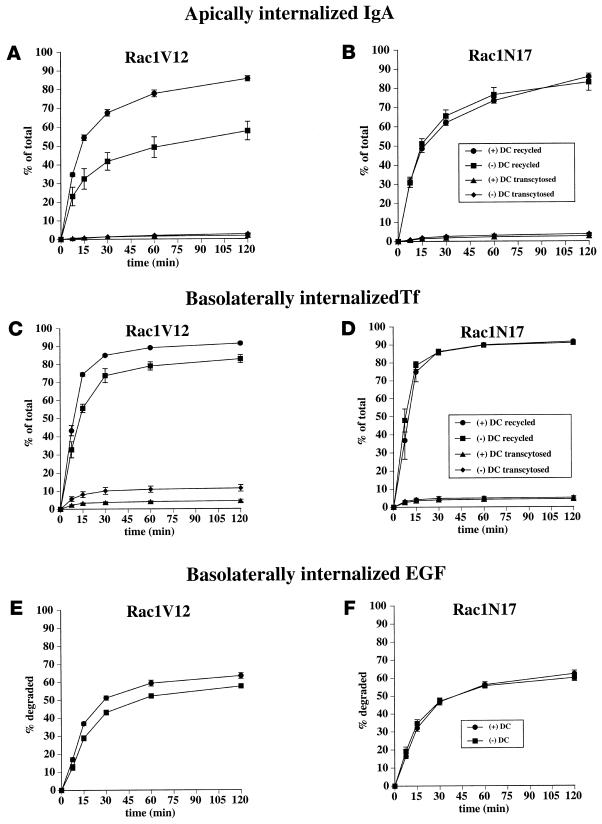
Figure 7.
Postendocytic fate of apically internalized IgA, basolaterally internalized Tf, and basolaterally internalized EGF in cells expressing Rac1V12 or Rac1N17. (A and B) [125I]IgA was internalized from the apical surface of the cells for 10 min at 37°C, and the cells were washed and then chased for 120 min. The percentage of total ligand released apically (recycled) or basolaterally (transcytosed) in cells expressing Rac1V12 (A) or Rac1N17 (B) is shown. Values for degradation were as follows: Rac1V12 + DC, 7.6 ± 0.7%; Rac1V12 − DC, 11.3 ± 1.1%; Rac1N17 + DC, 7.3 ± 0.3%; Rac1N17 − DC, 5.2 ± 0.4%. Values for ligand remaining cell associated were as follows: Rac1V12 + DC, 5.1 ± 0.9%; Rac1V12 − DC, 28.3 ± 4.8%; Rac1N17 + DC, 4.3 ± 0.7%; Rac1N17 −DC, 7.8 ± 3.9%. Values (mean ± SD; n = 3) are from a representative experiment. (C and D) [125I]Tf was internalized from the basolateral surface of the cells for 30 min at 37°C, and the cells were washed and then chased for 120 min at 37°C. The percentage of total ligand released apically (transcytosed) or basolaterally (recycled) in cells expressing Rac1V12 (C) or Rac1N17 (D) is shown. Values for degradation were as follows: Rac1V12 + DC, 2.8 ± 0.1%; Rac1V12 − DC, 2.8 ± 0.1%; Rac1N17 + DC, 2.2 ± 0.3%; Rac1N17 − DC, 1.7 ± 0.2%. Values for ligand remaining cell associated were as follows: Rac1V12 + DC, 1.8 ± 0.2%; Rac1V12 − DC, 3.1 ± 0.4%; Rac1N17 + DC, 1.8 ± 0.6%; Rac1N17 − DC, 2.3 ± 0.6%. Values (mean ± SD; n = 4) are from a representative experiment. (E and F) [125I]EGF was internalized from the basolateral surface of the cells for 10 min at 37°C, and the cells were washed and then chased for 120 min. The percentage of total degraded ligand in cells expressing Rac1V12 (E) or Rac1N17 (F) is shown. Values for transcytosis were as follows: Rac1V12 + DC, 8.7 ± 0.7%; Rac1V12 − DC, 11.5 ± 0.8%; Rac1N17 + DC, 10.0 ± 1.2%; Rac1N17 − DC, 12.1 ± 1.0%. Values for ligand recycling were as follows: Rac1V12 + DC, 22.8 ± 1.7%; Rac1V12 − DC, 24.6 ± 0.8%; Rac1N17 + DC, 21.5 ± 0.8%; Rac1N17 − DC, 22.6 ± 1.1%. Values for ligand remaining cell associated were as follows: Rac1V12 + DC, 5.2 ± 0.5%; Rac1V12 − DC, 6.6 ± 0.5%; Rac1N17 + DC, 5.3 ± 1.0%; Rac1N17 − DC, 5.4 ± 1.0%. Values (mean ± SD; n = 4) are from a representative experiment.

