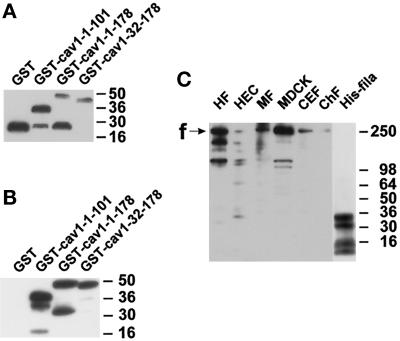
Figure 4.
Characterization of fusion proteins and antibodies. Samples were separated by SDS-PAGE and electrotransferred onto polyvinylidene difluoride membranes. (A) Detection of GST fusion proteins with the use of an anti-GST antibody. GST appears as a single band at 26 kDa, whereas full-length and several degradation products are seen with GST–caveolin-1 fusion proteins. (B) Detection of the same GST fusion proteins as in A with the use of a polyclonal anti-caveolin-1 antibody. GST is not recognized. In contrast, the caveolin-1–containing proteins show strong immunoreactivity. (C) Specificity and cross-reactivity of the antiserum pab228. In cell lysates from human fibroblasts (HF), human endothelial cells (HEC), mouse 3T3-RSV fibroblasts (MF), Madin-Darby canine kidney cells (MDCK), and chicken embryonic fibroblasts (CEF), bands around 250 kDa and some smaller bands probably representing degradation products of filamin are recognized. Purified chicken filamin (ChF; 13 ng) is also recognized. The position of full-length filamin is indicated with “f.” Four bands in the hexa-histidine–tagged filamin-28 isolate are detected (His-fila). The two upper bands probably reflect full-length and C-terminally shortened His6–filamin-28 protein. Apparent molecular weights are indicated to the right in each panel.

