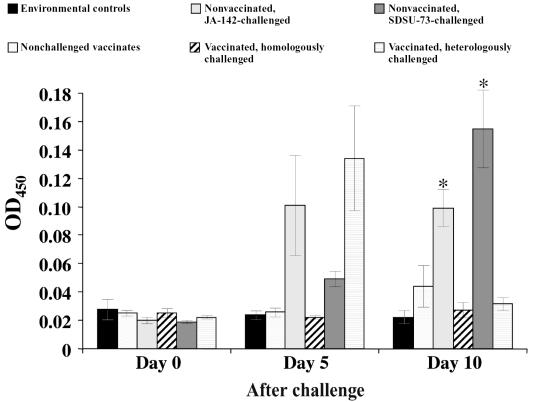
Figure 3.
Serum IFN-γ concentrations before and on days 5 and 10 after homologous and heterologous challenge of vaccinated and nonvaccinated pigs. On day 10 the asterisks indicate significant differences (P ≤ 0.05) between vaccinated and nonvaccinated groups whether challenged with PRRSV strain JA-142 or strain SDSU-73. The differences between the environmental control pigs and the 3 groups of vaccinated pigs were not significant on day 10. OD — optical density.

