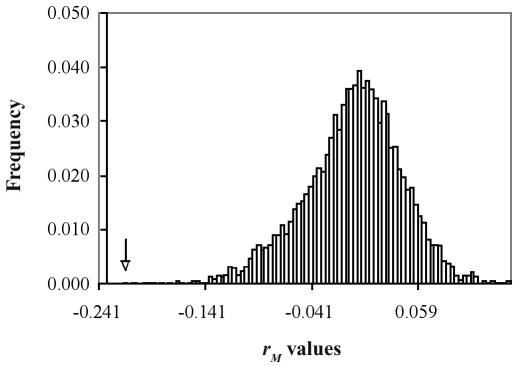
Figure 1.
Mantel statistic values for the null hypothesis of no correlation between percentage of genetic similarity among isolates of Porcine reproductive and respiratory syndrome virus and geographic distance between the source of the isolates. The arrow indicates the position of the statistic value (rM = −0.217, in the zone of null hypothesis rejection; P = 0.0002) calculated from the original, nonpermuted data in the frequency distribution curve generated from 10 000 random permutations of the same data.

