
Figure 5.
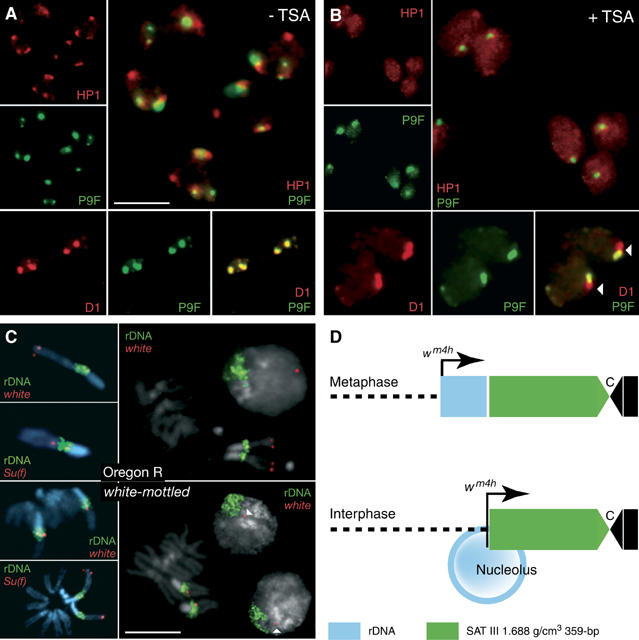
SAT III and rDNA repeats define alternative D1 and HP1 domains. Neuroblasts from control (A) or TSA-fed (B) third-instar larvae were immunostained for HP1 or D1 (red) and counterstained with P9F (green). Individual and merged signals are as indicated in the photographs. TSA feeding induces a delocalization of HP1 to the nucleoplasm and an extension of the D1 signal from SAT III to an adjacent P9F-negative region that corresponds to the rDNA repeats. (C) The results of FISH experiments performed with white and Su(f) probes (red) or a full-length rDNA probe (green). Photographs at the top and bottom show results obtained from wild-type Oregon R or wm4 neuroblasts, respectively. Arrowheads indicate the white signal detected in interphase nuclei. Scale bars: 5 μm. (D) The juxtaposition of the rDNA-linked white gene to SAT III repeats as a result of looping out of rDNA sequences in the nucleolus.