Figure 1.

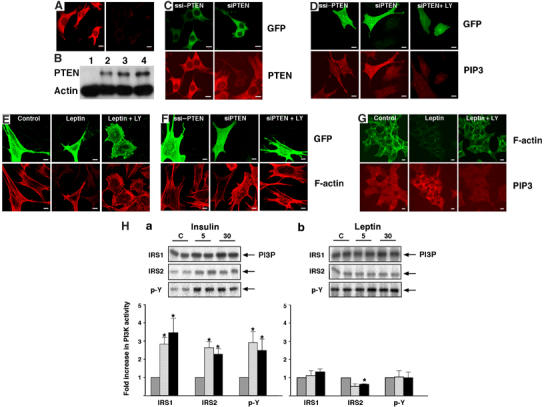
PTEN controls PtdIns(3,4,5)P3, F-actin levels and leptin sensitivity. (A) Immunocytochemical detection of PTEN in N29/4 cells using a Cy3 secondary antibody on cells treated with monoclonal PTEN antibody (left) and secondary antibody control (right). (B) Western blot analysis of PTEN expression in U87MG (lane 1), GT1–7 (lane 2), N29/4 (lane 3) cells and rat brain (lane 4). (C) N29/4 cells were transfected with scrambled PTEN siRNA sequence (ssi-PTEN) or siRNA sequence for PTEN (siPTEN) and identified by GFP co-expression (top panels). Effects on expression of endogenous PTEN determined by immunocytochemical detection (lower panels). (D) PtdIns(3,4,5)P3 levels in N29/4 cells transfected with siPTEN (marked by co-transfected GFP, upper panels) were investigated using a PtdIns(3,4,5)P3 antibody (lower panels) and compared to cells transfected with ssiPTEN, and those also treated with the PI3K inhibitor LY294002. (E) PTEN-GFP was overexpressed in N29/4 cells (upper panels) and F-actin visualized with Alexa 594-phalloidin (lower panels) with and without stimulation with 10 nM leptin. Note that untransfected cells in the leptin treated group are not easily visible in the lower panels due to leptin stimulated F-actin de-polymerization. (F) F-actin levels were visualized (lower panels) in N29/4 cells transfected with siPTEN or control ssiPTEN (visualized by co-transfected GFP, upper panels). The dependence of the RNAi effects on PI3K activity was determined by treatment of cells with 10 μM LY294002 (right panels). (G) Cellular F-actin distribution and PtdIns(3,4,5)P3 levels were visualized using Alexa 488-phalloidin (top panels) and an antibody to PtdIns(3,4,5)P3 (lower panels), respectively, in N29/4 cells in the absence (left panels) or presence of 10 nM leptin (middle panels) and 10 nM leptin+10 μM LY294002 (right panels). (H) Changes in insulin receptor substrate-1 (IRS-1), IRS-2 and phosphotyrosine (p-Y) associated PI3K activity in N29/4 cells stimulated with 10 nM (a) insulin or (b) leptin. Representative phosphor images obtained from the thin-layer chromatography plate showing PI(3)P production (upper panels). Normalized levels of PI(3)P are shown in the lower panels, relative to individual saline control group, following 5 (hatched bars) and 30 (filled bars) minutes exposure to hormone. Values represent the mean±s.e.m. for 3–4 experiments per group (*P<0.05, compared to control levels for each treatment). Scale bars: 10 μm.
