
Figure 2.
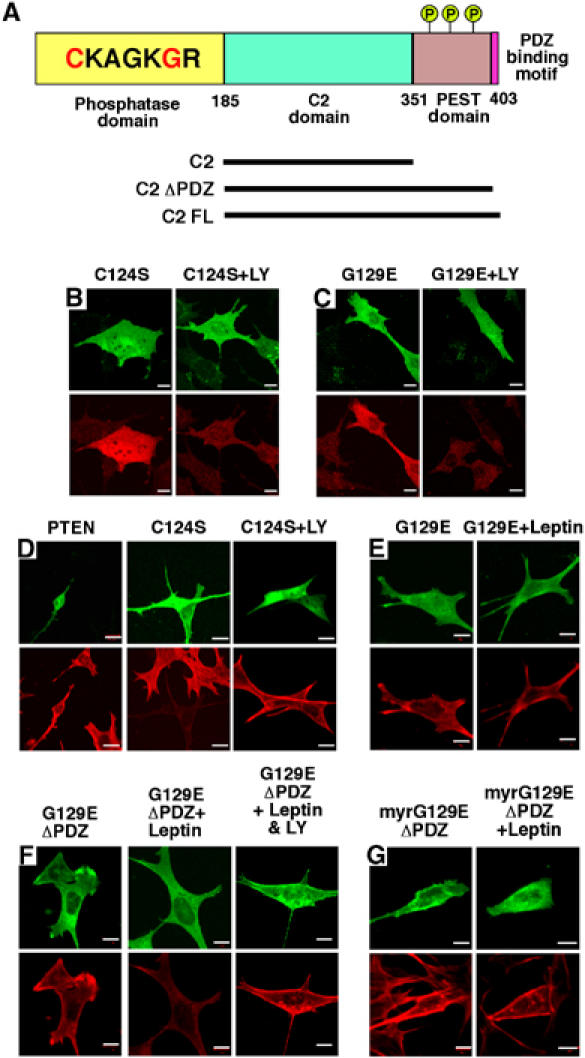
Effects of PTEN mutants on F-actin levels. (A) Schematic of PTEN and constructs used in this study. The N-terminal phosphatase domain (amino acids 1–185) is shown with the catalytic core and the missense mutations highlighted in red: C124S giving a lipid- and protein-phosphatase inactive protein and G129E a lipid-phosphatase inactive, protein-phosphatase active protein. The C2 (186–351) and PEST domains associated with phospholipid binding and protein stability, respectively, and the PDZ binding sequence, important for protein–protein interactions, are shown. Several C2 domain mutants were tested for inhibition of leptin action on F-actin: C2 (182–355), C2ΔPDZ (182–398) and C2FL (182–403). Phosphorylation sites on the C-terminal tail are represented by a circled letter P. The effects of overexpression of C124S PTEN-GFP (B) and G129E PTEN-GFP (C) in N29/4 cells (upper panels) on PtdIns(3,4,5)P3 levels (lower left), are shown, and in the presence of 10 μM LY294002 (lower right). (D) F-actin was visualized (lower panels) in cells overexpressing PTEN-GFP (top left), C124S PTEN-GFP (upper middle and upper right) in the absence (middle) or in the presence (right) of 10 μM LY294002. (E, F) F-actin visualized (lower panels) in N29/4 cells overexpressing G129E PTEN-GFP (E), G129EΔPDZ PTEN-GFP (F) (upper panels) without (left) and with 10 nM leptin (middle) and 10 nM leptin+10 μM LY294002 (right) stimulation. (G) F-actin visualized (lower panels) in cells overexpressing myrG129EΔPDZ PTEN-GFP (upper panels) in the absence (left panels) and presence (right panels) of 10 nM leptin. Scale bars: 10 μm.