
Figure 4.
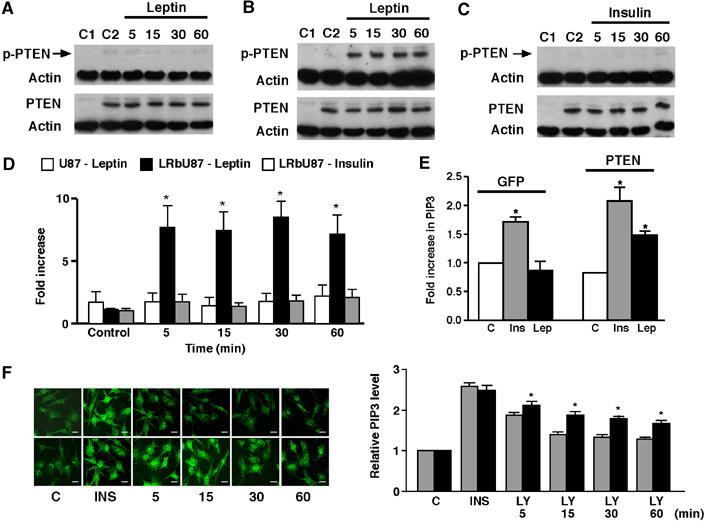
ObRb is necessary for phosphorylation of PTEN by leptin. (A) U87MG cells were infected with virus encoding PTEN for 24 h before stimulation with 10 nM leptin for 5, 15, 30 and 60 min. LRbU87 cells were infected and stimulated with 10 nM leptin (B) and 10 nM insulin (C). Cells were lysed and p-PTEN levels assessed, the blot stripped and re-probed with antibody raised against PTEN with actin expression used as a loading control. C1 and C2 denote control U87MG (A) and LRbU87 (B, C) cells in the absence (C1) and presence (C2) of PTEN infection. (D) Bar graph showing mean normalized p-PTEN against total PTEN levels for U87 cells (n=3) and LRbU87 cells (n=4), infected with PTEN, stimulated by leptin (n=4) and by insulin (n=4) for up to 60 min. (*P<0.05, compared to U87MG cells stimulated with leptin or LRbU87 cells stimulated with insulin). (E) PtdIns(3,4,5)P3 levels in response to leptin and insulin. LRbU87 cells, metabolically labelled and infected with viruses expressing either GFP (left) or PTEN (right), were stimulated with 10 nM leptin or 500 nM insulin for 10 min, and cellular PtdIns(3,4,5)P3 determined. Data are presented as mean PtdIns(3,4,5)P3 measurement relative to unstimulated control GFP expressing cells, from three samples±s.d. The data point for unstimulated GFP expressing cells corresponds to 1107 dpm in the PtdIns(3,4,5)P3 peak, or 0.034% of PtdIns. (F) N29/4 cells were stimulated with insulin (10 nM) for 5 min, cells washed with LY294002 (100 μM) alone (upper panels) or LY and leptin (10 nM; lower panels), and the levels of PtdIns(3,4,5)P3 followed with time by immunocytochemical staining for PtdIns(3,4,5)P3. Normalized PtdIns(3,4,5)P3 levels are presented with respect to untreated control cells (n=8). (*P<0.05, compared to LY alone). Scale bars: 10 μm.