
Figure 2.
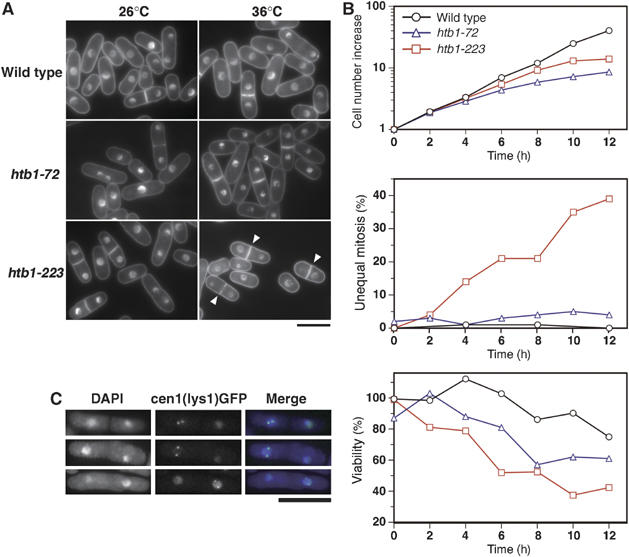
Cellular phenotypes of histone H2B mutants htb1-72 and htb1-223. Asynchronously growing htb1 mutant cells in YPD medium were shifted to 36°C for 0–12 h. (A) Mutant cells cultured at 26°C (left panels) or 36°C for 8 or 12 h (right panels) were stained by DAPI. Upper panels, wild type; middle panels, htb1-72; lower panels, htb1-223. Arrowheads indicate binucleate cells displaying unequal nuclear division. Bar, 10 μm. (B) Top, cell number increase; middle, the frequencies of unequal nuclear division; bottom, cell viability. (C) Unequal chromosome segregation was examined by the cen1(lys1)-GFP method (see text). Three examples of htb1-223 mutant cells cultured at 36°C for 10 h displaying unequal segregation of cen1(lys1)-GFP signals are shown. Bar, 10 μm.