
Figure 6.
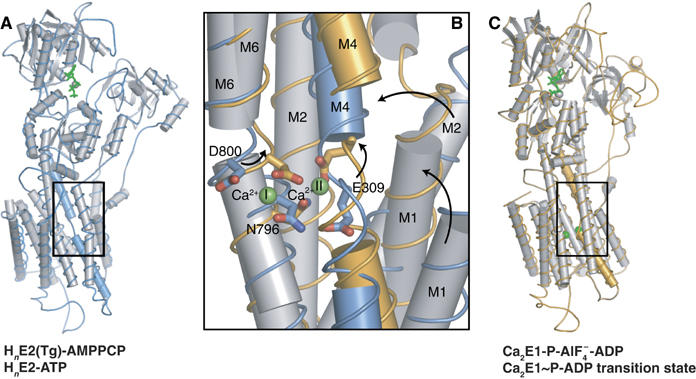
Conformational changes upon Ca2+ binding to nucleotide bound ATPase. (A) Overall representation of HnE2(Tg)-AMPPCP structure shown in gray cartoon with cylindrical helices, and with the M4 helix colored blue. (B) Close-up view of the Ca2+ binding site with HnE2(Tg)-AMPPCP form (blue) superpositioned (on residues 800–994) on the Ca2E1-ADP:AlF4− form (orange). (C) Overall representation of Ca2E1-ADP:AlF4− corresponding to (A), but with the M4 helix shown in orange. In all figures, the nucleotide is shown in green ball-and-stick representation, Ca2+ ions are shown as green spheres and key residues involved in Ca2+ binding in ball-and-stick representation with blue (E2) and orange (E1).