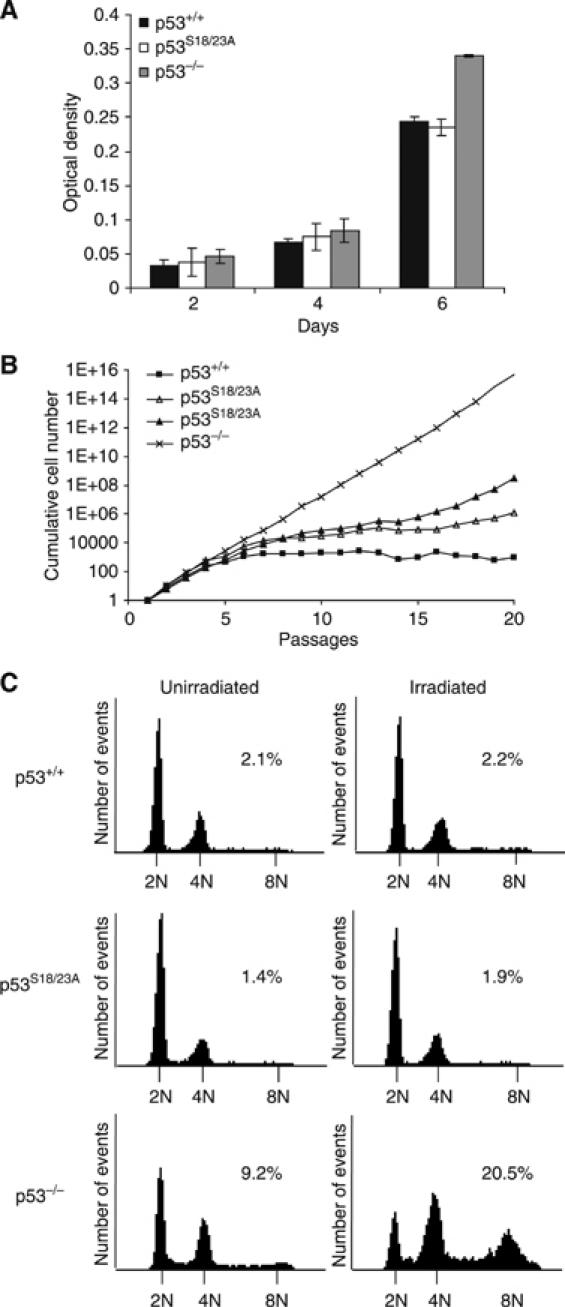
Figure 3.

Cellular proliferation and polyploidy of p53S18/23A cells. (A) Proliferation of thymocytes derived from WT, p53S18/23A and p53−/− mice. Thymocytes were activated with 5 ng/ml PMA, 500 ng/ml ionomycin, and proliferation was measured after 2, 4 or 6 days of stimulation. Mean values from triplicate wells are shown with error bars. (B) 3T3 proliferation assay of WT, p53S18/23A and p53−/− MEFs. MEFs were serially passaged with a plating density of 3 × 10⁵ cells per 6 cm plate and counted once every 3 days up to 20 passages. Cumulative cell numbers, based on the average of duplicate plates for each passage, are shown. Data from two independent p53S18/23A MEFs are presented. (C) Polyploidy in WT, p53S18/23A and p53−/− MEFs before (left panels) and 24 h after IR (right panels). Genotypes are indicated to the left. Histograms show DNA content on X-axis versus cell number on Y-axis. The peaks representing 2N, 4N and 8N cells are indicated. The percentage of total cells with over 8N DNA content is shown.
