Figure 4.

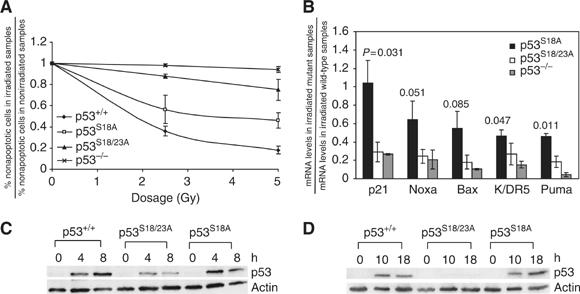
p53 stabilization and activity in p53S18/23A thymocytes after IR. (A) p53-dependent apotosis of WT, p53−/−, p53S18A and p53S18/23A thymocytes 24 h after exposure to 2.5 Gy and 5 Gy IR. Mean values from three independent experiments are shown with standard deviation. (B) p53-dependent transcription of its target genes in p53S18A, p53S18/23A and p53−/− thymocytes as compared to that in WT thymocytes 18 h after 5 Gy IR. Mean values from two independent experiments are shown with error bars. P-values between the levels of reduction in p53S18/23A thymocytes and p53S18A thymocytes are given. Protein levels of p53 in WT, p53S18/23A and p53S18A thymocytes at earlier (C) or later time points (D) after 5 Gy IR. Genotypes and time points are indicated on the top. p53 and actin are indicated on the right.
