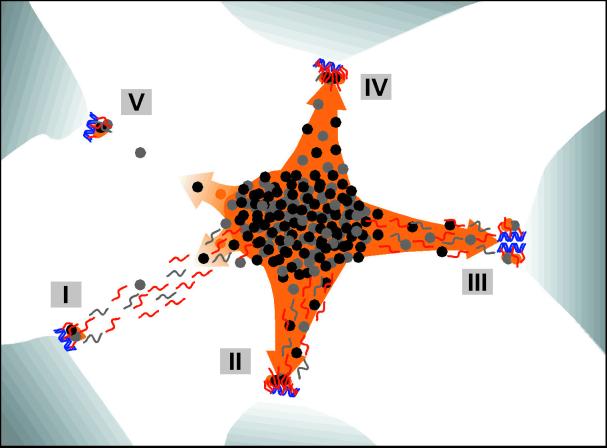
Figure 6.
Explanatory sketch of the patterns for genes, transcripts, and splicing factors. Blue helices, genes; red and gray segments, RNA; black, gray, and orange dots, splicing factors; orange area, speckle; orange arrows, recruitment of splicing factors; concentrated dots in the center with the overall ellipsoidal shape, IGC; dots and the gray segments outside of the IGC, PFs. Blue, red, and orange correspond to fluorescence images; EM is in grayscale. (I) Transcription is moderate (or even high), and co-transcriptional splicing is at a low or moderate level. The recruitment of splicing factors is relatively low; much of the unprocessed pre-mRNA is trafficking to IGC. Here, the RNA trafficking clearly prevails over the recruitment of splicing factors, and visualized RNA tracks are associated with the splicing factor reservoirs as observed in Namalwa cells. (II) Example similar to the previous case, but co-transcriptional splicing prevails. There is an elevated recruitment of splicing factors, and (most of) the visualized RNA (RNA tracks) becomes part of the speckle. The corresponding gene becomes associated with the speckle. (III) Example of the local site of high transcriptional activity (depicted here from the clustered genes) and both co- and post-transcriptional splicing. The splicing factors are highly recruited, and both the RNA (as observed in Raji cells) and the genes are extensively engulfed in the speckle. This example is similar to II. (IV) Example of a highly transcribed gene, high recruitment of splicing factors, and co-transcriptional splicing only. Both the RNA (as a spot) and the gene are associated with the speckle. This pattern has been observed rarely in the present study. (V) Example of an endogenous gene expressed at a low level. Transcription is low, as is the recruitment of splicing factors. Visualized RNA appears as a spot at the site of transcription (because of relatively elevated local RNA accumulation), and any directed movement of released RNA is below the level of detection. However, this situation also corresponds to the expressed genes after resumption of RNA synthesis, as seen after DRB treatment of Namalwa cells in this study.

