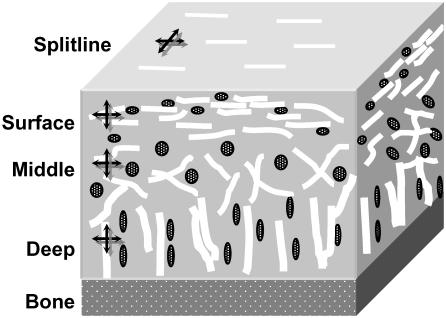
FIGURE 2.
Schematic of cartilage showing collagen orientation and cell shape in the three zones in the thickness direction and on the surface in the split line direction (black line shows pin prick; white lines show collagen fibers). The crossed arrows show the direction of anisotropy measurements in each region.

