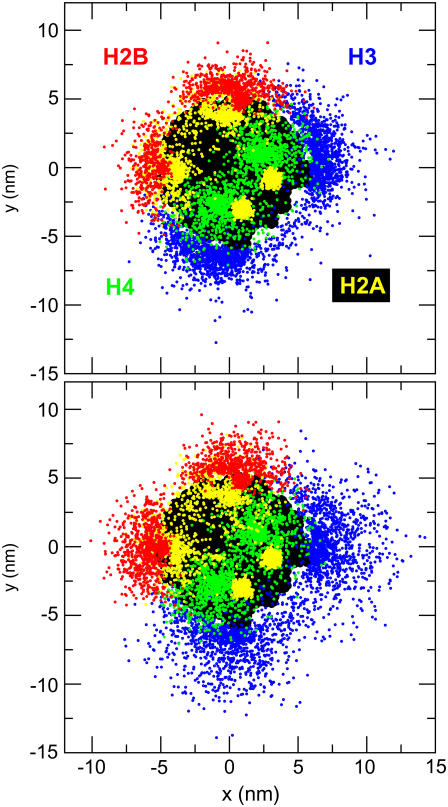
FIGURE 7.
Positional distribution of histone tail beads projected onto the a-b plane of the nucleosome. Top and bottom figures correspond to monovalent salt concentrations of 0.01 M and 0.2 M, respectively. Color-coding for the histone tails is as follows: H3 (blue), H4 (green), H2A (yellow), and H2B (red). The nucleosome core in the background is colored black.

