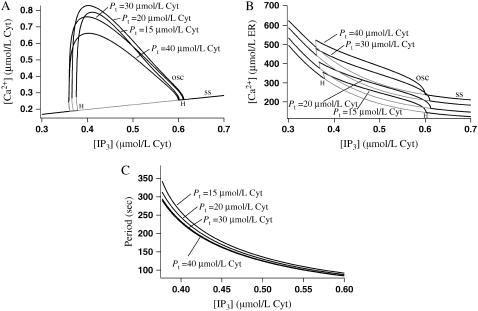
FIGURE 6.
Bifurcation diagrams showing the effect of increasing Pt from 15 μmol/L Cyt to 20 μmol/L Cyt, 30 μmol/L Cyt, and 40 μmol/L Cyt while keeping s fixed at 1. The buffering SERCA pump is used here. Shaded lines denote unstable branches and H denotes a Hopf bifurcation. The curve of steady states is labeled ss and the maximum value over an oscillation is labeled osc. (A) Cytosolic calcium concentration. (B) ER calcium concentration. (C) Oscillation period.

