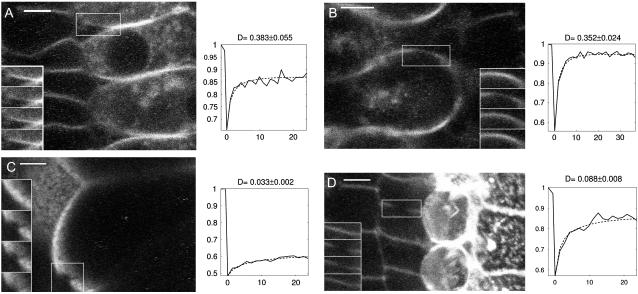
FIGURE 8.
Examples of in situ profile bleach experiments with the lipid dye di-8 ANEPPS. (A) Inner hair cells. (B) Outer hair cells. (C) Hensen cells. (D) Outer pillar cells. In each, a focal view of the structure just after the bleach is shown and the corresponding intensity recovering curves averaged within the bleach spot are plotted (solid curves, experiment; dashed curve, simulation). The insets in the images show details of the simulation region at different times in the series (images 1, 2, 3, and last image, starting from the bleach). Note that the recovery in sensory hair cells is faster than in the supporting cells. Scale bars, 5 μm.

