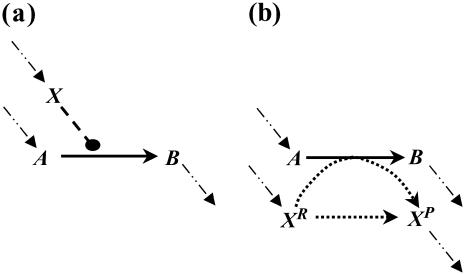
FIGURE 2.
Modeling activating interactions. Shown in a is the chemical transformation A→B, which is activated by the chemical entity X. Activation interaction is indicated by an arrow with a dot at its tail. Shown in b is the pathway resulting after accounting for activation. The activator X is duplicated as XR and XP. The new transformations introduced are represented by dotted arrows. In both panels, the dashed arrows account for the production and transfer of chemical entities.

