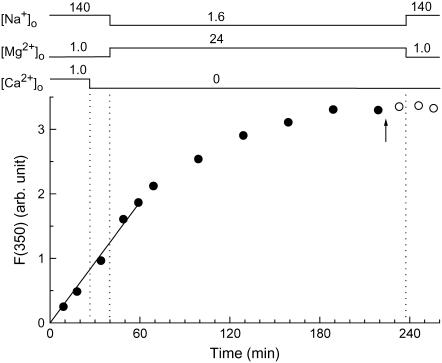
FIGURE 3.
Furaptra fluorescence intensities at 350 nm excitation measured from a single myocyte during and after exposure (solid and open circles, respectively) to 5 μM furaptra AM plus 0.1% DMSO. The arrow indicates the time at which furaptra AM was washed out. [Na+]o, [Mg2+]o, and [Ca2+]o were changed as indicated on top at the times shown by vertical dotted lines. After an initial incubation of the cell in normal Tyrode's solution and the following brief incubation in the Ca-free Tyrode's solution, the bathing solution was changed to the Mg-loading solution that contained 24 mM Mg2+ and 1.6 mM Na+ for ∼200 min, and then Ca-free Tyrode's solution was reintroduced. A solid line was drawn by linear regression to data points for the initial 60 min, and had a slope of 0.0312/min. Cell 091504-2.

