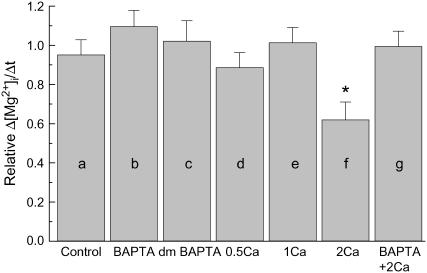
FIGURE 5.
Summary of the initial Δ[Mg2+]i/Δt estimated from the type of experiments shown in Fig. 4. All values of the initial Δ[Mg2+]i/Δt were normalized to those expected for the initial [Mg2+]i to calculate relative Δ[Mg2+]i/Δt (see text for details). Columns a–g show mean ± SE of 4–8 cells (see Table 2 for the number of cells). (a) The initial Δ[Mg2+]i/Δt was estimated without intracellular chelator loading and in the essential absence of extracellular Ca2+. (b–c) Cells were loaded with BAPTA (b) or dimethyl BAPTA (c), and the initial Δ[Mg2+]i/Δt was estimated in the essential absence of extracellular Ca2+. (d–f) the initial Δ[Mg2+]i/Δt was estimated at 0.5 mM (d), 1.0 mM (e), or 2.0 mM [Ca2+]o (f) without intracellular loading of the chelator. (g) Cells were loaded with BAPTA, and initial Δ[Mg2+]i/Δt was estimated at 2.0 mM [Ca2+]o. *Significantly different from 1.0 (0.01 ≤ P < 0.05).

