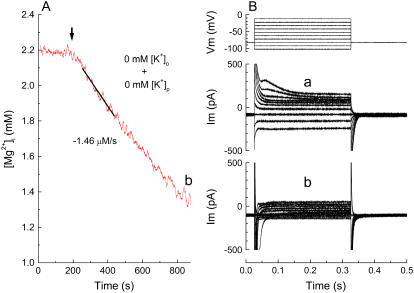
FIGURE 8.
Measurements of initial Δ[Mg2+]i/Δt and membrane currents from the same myocyte. (A) Mg2+ efflux induced after intracellular perfusion with the K+-free pipette solution (145 Cs solution, Table 1). The cells were loaded with Mg2+ in the Mg-loading solution, and patch-clamped with a pipette that contained 145 Cs solution. Extracellular Na+ (70 mM) was applied at the time indicated (arrow) in the absence of extracellular K+ (see text for details). The holding potential was −13 mV during the fluorescence measurement. (B) Membrane currents recorded shortly after initiation of intracellular perfusion in the Mg-loading solution (a) and just after the fluorescence measurement (shown in A) in the 0 K-70 Na solution (b). The holding potential was −83 mV and 300-ms pulses were applied in 10-mV increments as shown at the top. Cell 040105, cell capacitance 150 pF. Series resistance was 8.5–8.1 MΩ at the time of initial Δ[Mg2+]i/Δt measurement. Similar results were obtained in two other myocytes.

