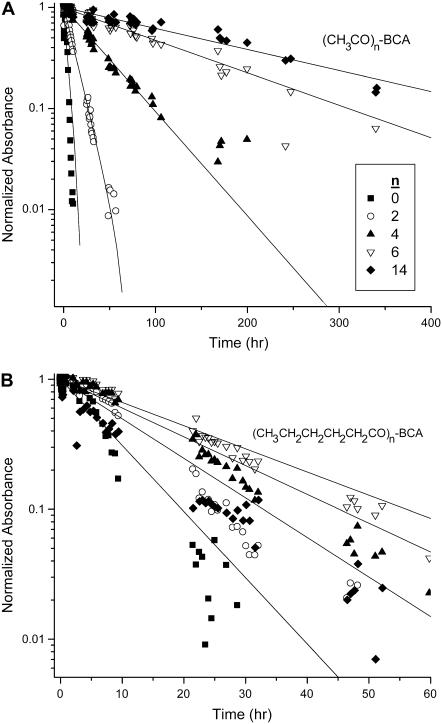
FIGURE 3.
Corrected areas (see text for details) as a function of time for representative rungs of (A) an BCA-Acn charge ladder and (B) a BCA-Hexn charge ladder. Deviations from linearity could be due to the fact that each rung of the charge ladder is made up of a mixture of regioisomers that may have different rates of denaturation. The data shown in this figure are from one experiment. (It is difficult to give experimental uncertainties to the points on the graph because the time at which the points were taken differed between repetitions of the experiment.)

