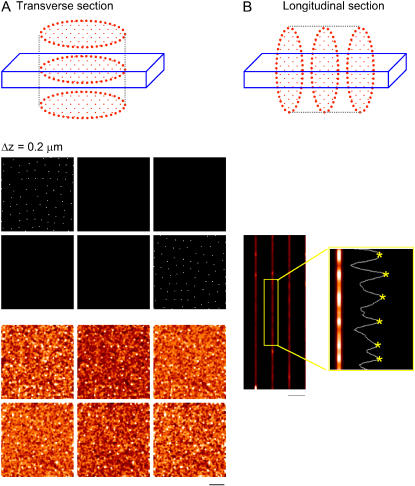
FIGURE 4.
Test of filter algorithm on a virtual cell. The top of panel A shows the transverse sectioning geometry of a model cell. The middle panel shows evenly spaced sections through the simulated data. The randomly placed pixels were set to appear as bright spots whose mean nearest neighbor distance was set to 1.0 μm. The lower panel shows the simulated confocal sections after blurring by convolving with the microscope PSF and adding noise. Note the bright spots appearing only on Z-lines in the unblurred myocyte (middle panel) are now seen on subsequent image planes in the blurred images (bottom panel). After processing these data with the algorithm used in Fig. 3, the mean nearest neighbor distance was 1.0 ± 0.2 μm and the median distance was 1.0 μm, as expected. Panel B shows simulated longitudinal section images generated from the same data set. The measured transverse spacing was 0.88 μm, which is shorter than the known set value of 1.0 μm, illustrating the artifactual reduction in transverse spacing seen in the longitudinal section.

