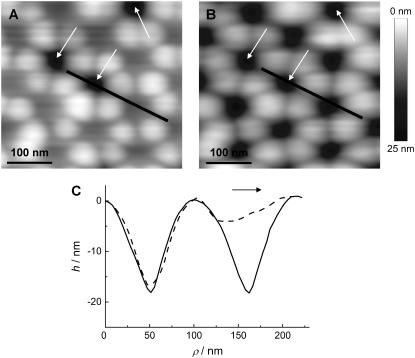
FIGURE 2.
Visualization of pore-spanning bilayers by AFM (contact mode in aqueous solution). (A) Pores covered by a DODAB bilayer imaged at low forces (0.9 nN). The arrows indicate uncovered pores. (B) Same region imaged at larger forces (2.7 nN). (C) Height profiles along the line shown in A, dashed line, and B, solid line, imaged at two different forces using NP-S cantilevers. Scan direction was from left to right as indicated by the arrow.

