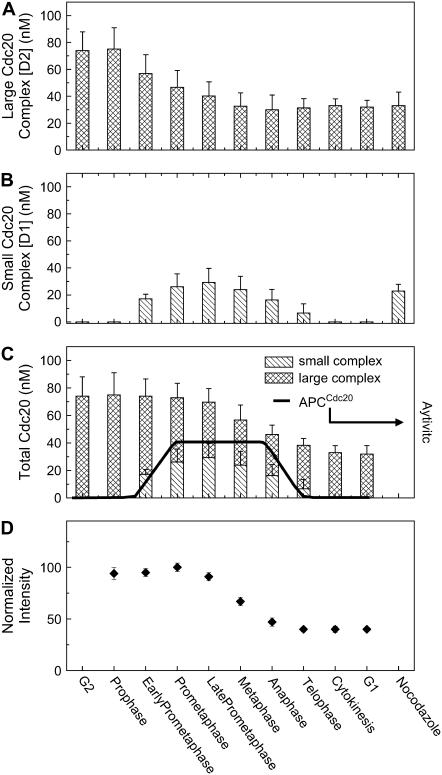
FIGURE 4.
Concentration of Cdc20 complexes is calculated based on the calibrated excitation volume of our system (26) and Ni obtained through the analysis of autocorrelation functions with Eq. 2. (A) Concentration of large Cdc20 complex (D2) across the cell cycle. (B) Concentration of small Cdc20 complex (D1) across the cell cycle. (C) The changes in the total concentration of Cdc20 across the cell cycle. The solid line represents the temporal pattern of APC/CCdc20 activities described in previous review (4). (D) The fluorescence intensity was monitored during the FCS measurements. It shows that in early mitosis the fluorescence intensity is stable, indicating a stable abundance of Cdc20 in the cells. The decrease in the intensity from late prometaphase reflects the degradation of Cdc20 during the mitotic exit.

