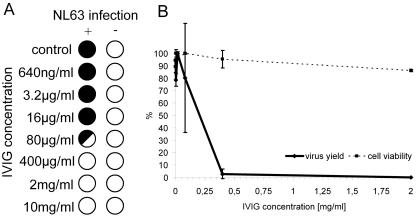
FIG. 2.
Inhibition of HCoV-NL63 by IVIG. (A) CPE reduction mediated by IVIG. Filled circles indicate CPE development, empty circles indicate the absence of CPE, and the half-filled circle represents the development of CPE in 50% of wells. (B) Decrease in HCoV-NL63 virus yield after IVIG treatment and cell viability assay. Numbers on the y axis represent the percentages of produced virus and percentages of viable cells.

