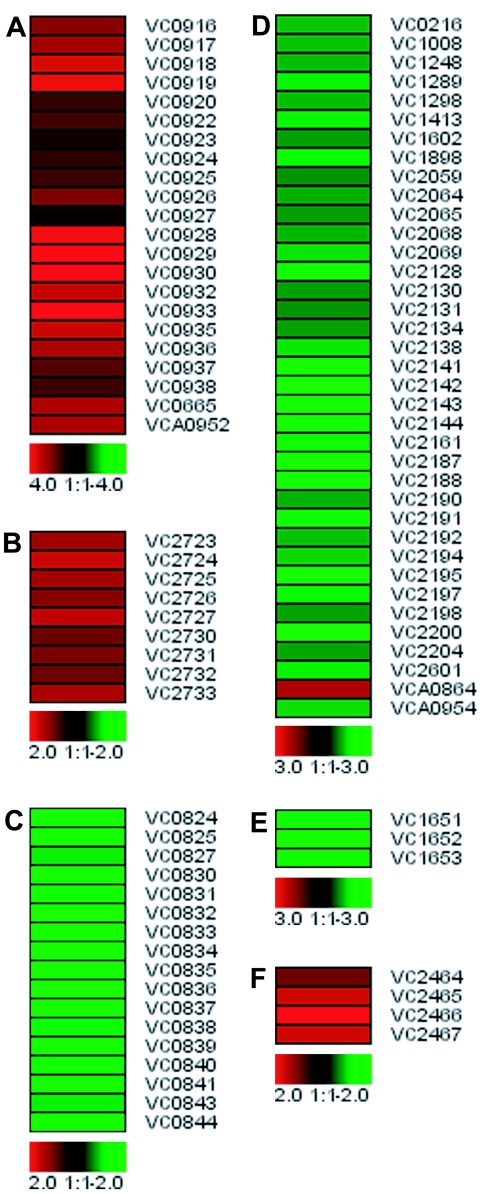
FIG. 4.
Heat maps of differentially expressed genes between C-wt and C-ΔvieA. The magnitude of expression is given with a color-coded scale (red, induced; green, repressed). The expression profiles of selected gene clusters, (A) vps, (B) eps, (C) genes located in VPI, (D) genes involved in chemotaxis and motility, (E) vieSAB, and (F) rseABC and rpoE, are shown.

