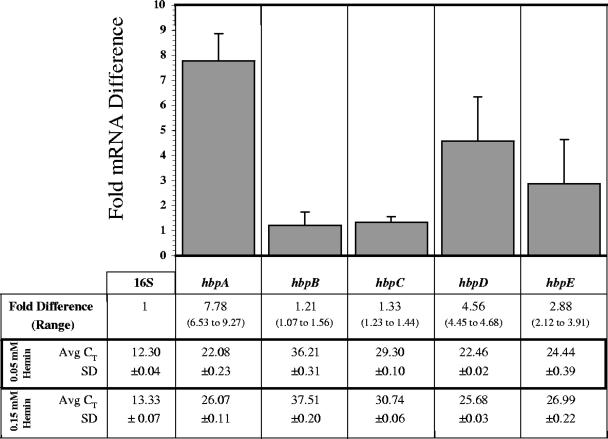
FIG. 3.
Fold differences in hbp mRNA following growth at a low hemin concentration (0.05 mM) relative to the control concentration (0.15 mM). At mid-log phase, the amount of target hbp mRNA transcript from 0.05 mM preparations was normalized to the amount of 16S rRNA and is relative to the quantity of that particular hbp mRNA transcript from 0.15 mM preparations. A representative experiment is shown, where CT values were determined in triplicate. SD bars were generated by comparing fold differences to those obtained from a second independent triplicate determination.

