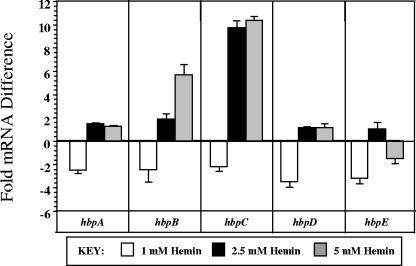
FIG. 4.
Fold differences in hbp mRNA at high heme levels from mid-log-phase cells. The amount of target hbp mRNA transcript from cultures grown in 1, 2.5, and 5 mM heme was normalized to the amount of 16S rRNA and is relative to the quantity of that particular hbp mRNA transcript from 0.15 mM preparations. A representative experiment is shown, where CT values were determined in triplicate. SD bars were generated by comparing fold differences to those obtained from a second independent triplicate determination.

