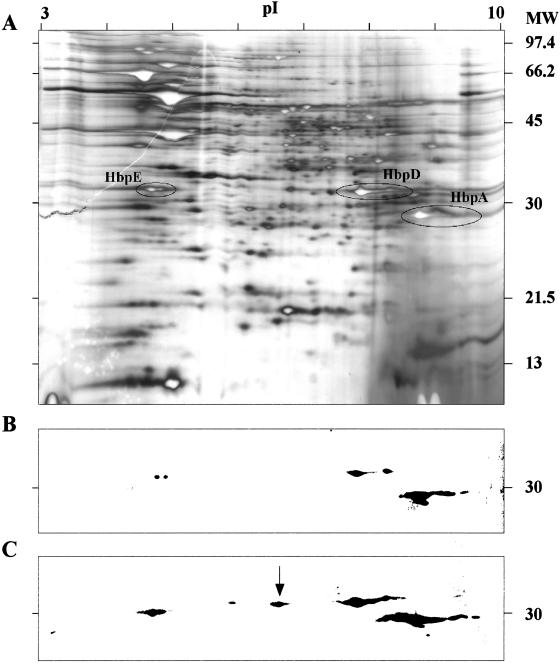
FIG. 5.
A. Two-dimensional SDS-PAGE gel of a whole-cell lysate of B. quintana grown for 96 h at the control hemin concentration (0.15 mM), with positions of HbpA, HbpD, and HbpE circled. B. Corresponding immunoblot of two-dimensional SDS-PAGE developed with anti-HbpA antiserum reacting with subgroup II Hbps. C. Immunoblot of two-dimensional SDS-PAGE of B. quintana grown to mid-log phase at a low hemin concentration (0.05 mM) developed with anti-HbpA showing significant increases in HbpA, HbpD, and HbpE. Identity of the Hbps was verified by MALDI-TOF MS, and the spot indicated with the arrow is additional HbpD not seen at the 0.15 mM heme level. The pI range of the IEF is shown at the top, and the molecular weight (MW) is given to the right in thousands.

